Data and the world Open dataSources and method
China's power gap: 4.7% in 2015, 2.0% in 2025
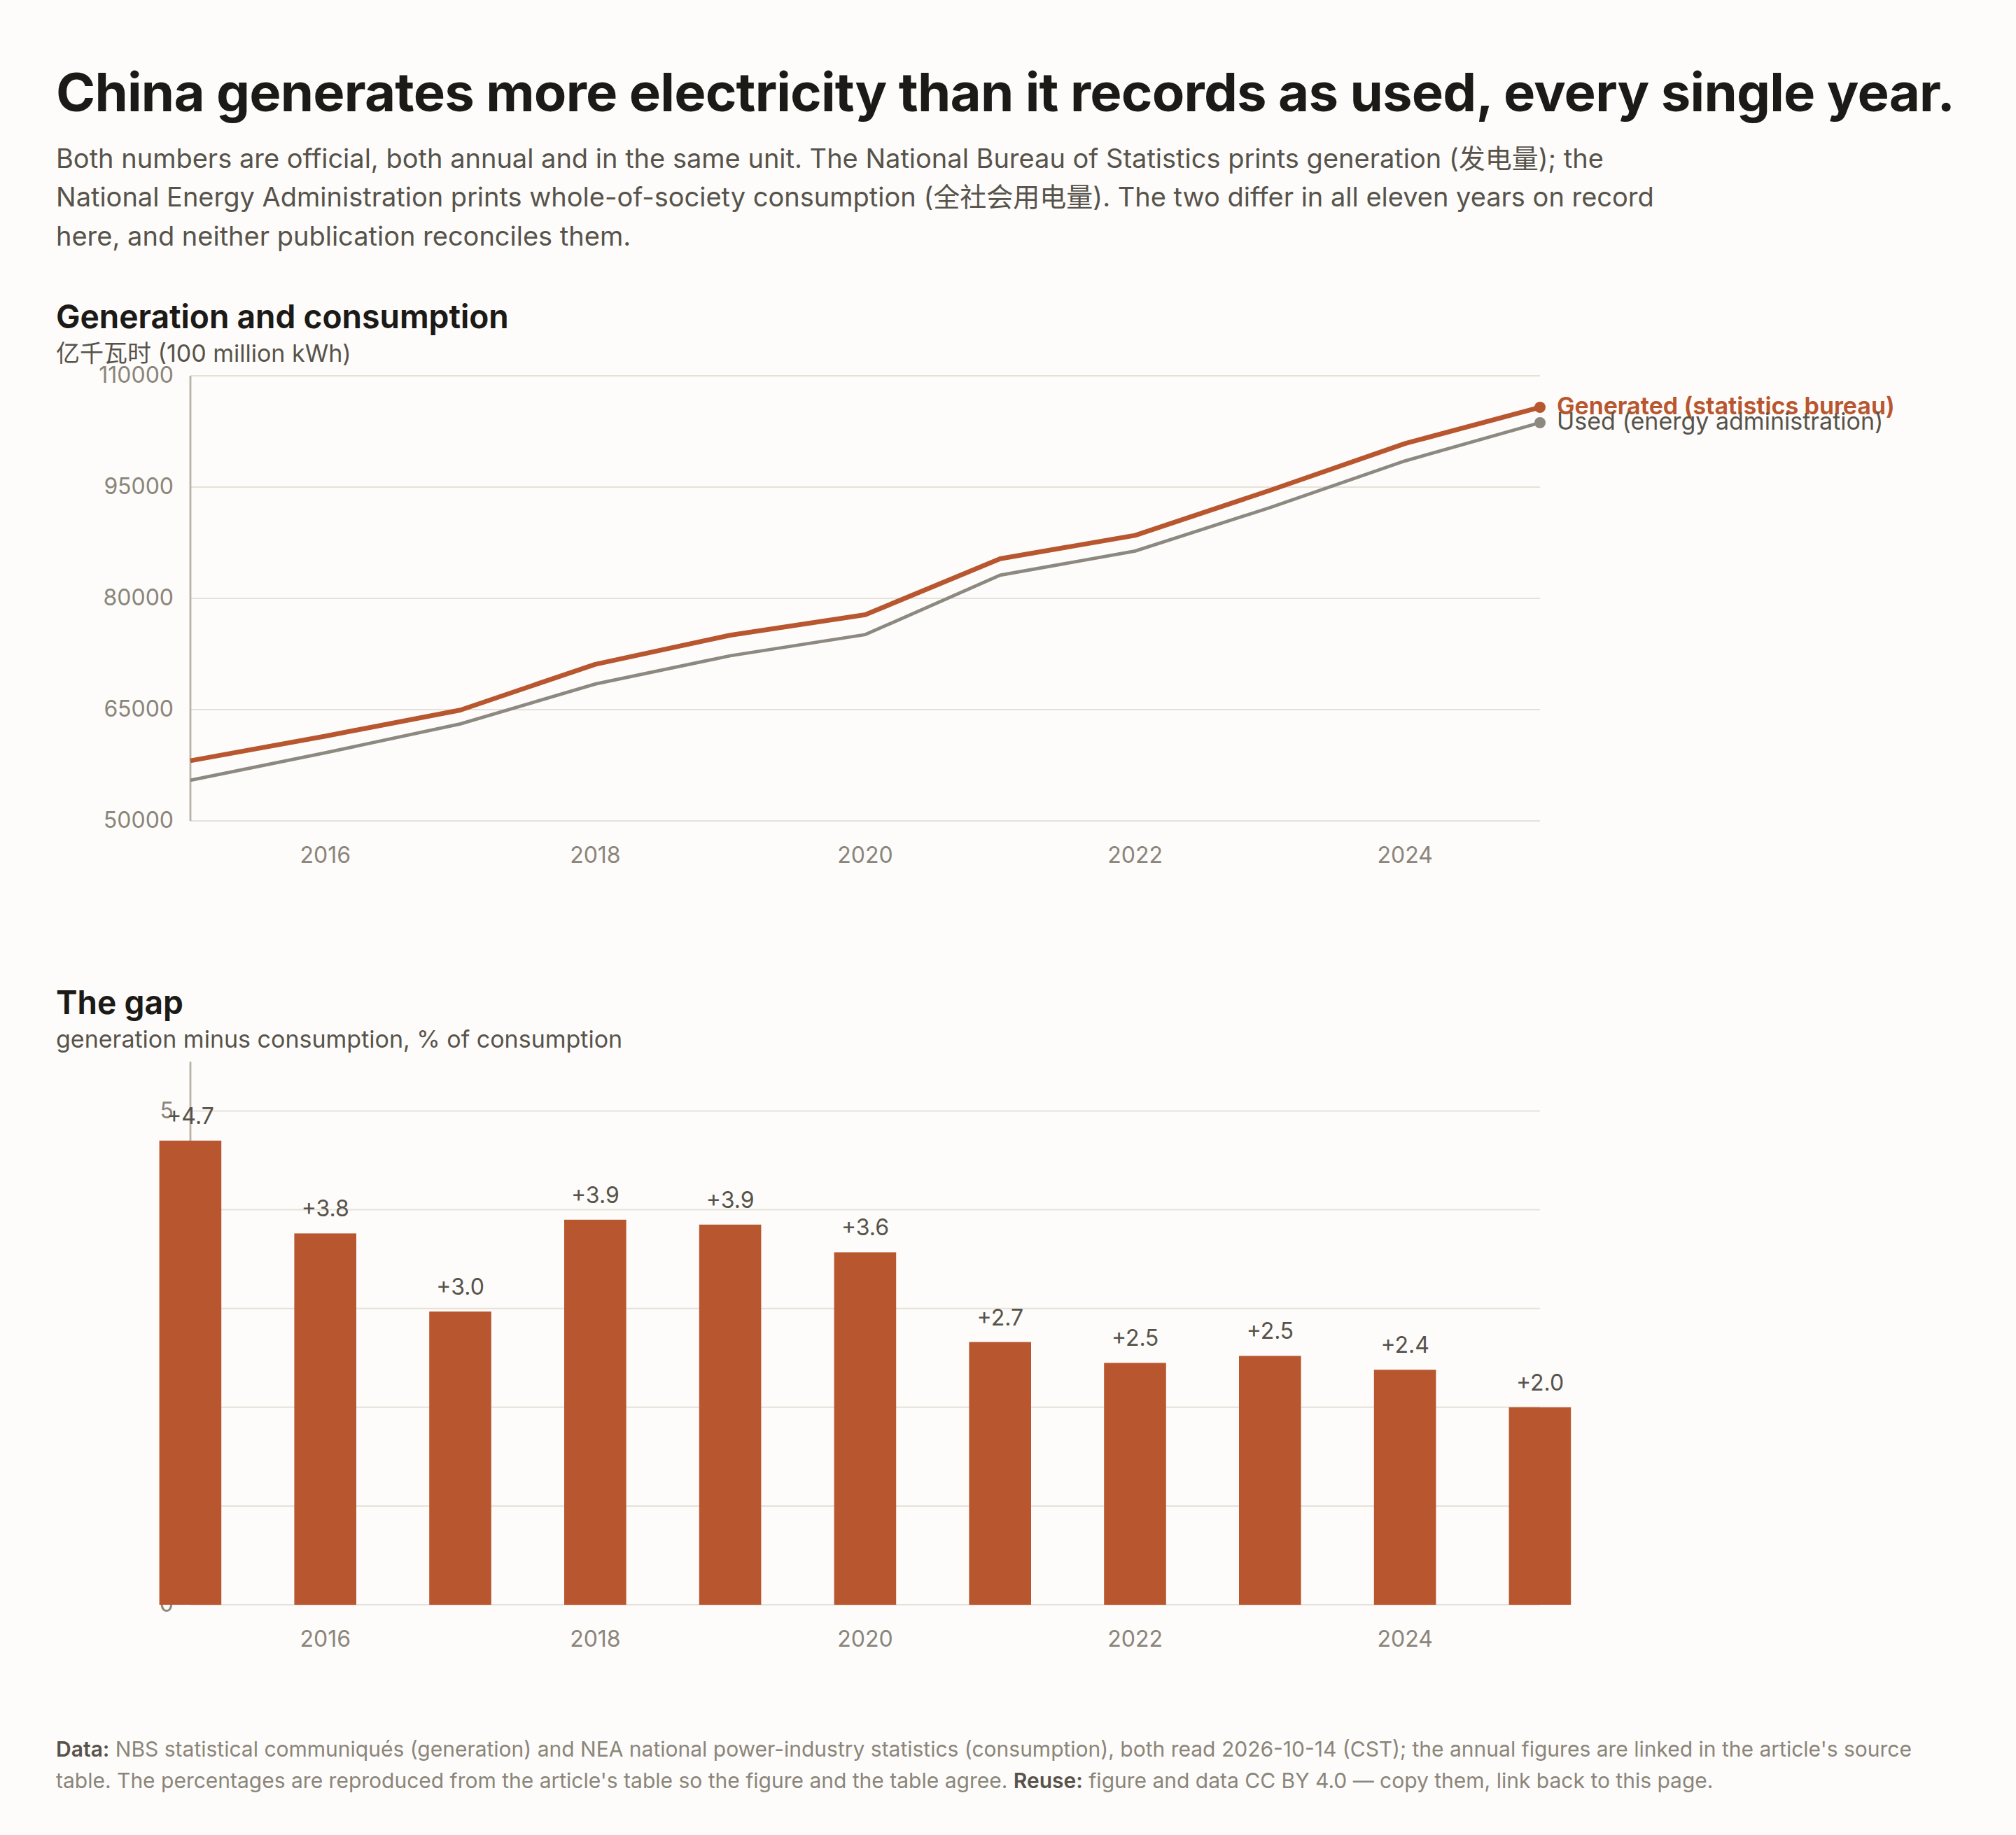
China's statistics office prints one annual power generation total, the energy administration another for consumption. The two differ every year.
Living page — numbers read from the sources on 2026-10-14, re-checked yearly.
China’s National Bureau of Statistics (NBS) says the country generated 105,752.5 亿千瓦时 of electricity in 2025, about 10,575 TWh (2025 communiqué, NBS, 2026-02-28). The National Energy Administration (NEA) says the whole of society used 103,682 亿千瓦时, or 10,368 TWh, in the same year (NEA, 2026-01-17).
Both are official, annual and in the same unit: the generation figure is 2,070.5 亿千瓦时 higher, 2.00% of the consumption figure. Neither publication reconciles the two, and no document I could find does either.
Ten years earlier the same pair gives 58,105.8 亿千瓦时 generated (2015 communiqué, NBS, 2016-02-29) against 55,500 亿千瓦时 consumed (NEA, 2016-01-15). That year the gap was 2,605.8 亿千瓦时, or 4.70% of consumption.
The same shape of problem shows up in a provincial GDP sum that misses the national figure and port throughput counted by two sources. Every number below was read on 2026-10-14 (CST); each is one vintage.
The figure is one PNG, power-generation-vs-consumption.png (2880 × 2622), and it can be read without the picture; the rows behind it are in china-power-generation-vs-consumption.csv with the rendering script make_figure_power_gap.py. Figure and data: CC BY 4.0.
The two totals, year by year
Amounts in 亿千瓦时 as printed. “Gap” is the generation column minus the consumption column; the percentage columns are my arithmetic.
| Year | Generation (NBS) | Consumption (NEA) | Gap | Gap as % of consumption | Gap as % of generation |
|---|---|---|---|---|---|
| 2015 | 58,105.8 | 55,500 | +2,605.8 | +4.70% | +4.48% |
| 2016 | 61,424.9 | 59,198 | +2,226.9 | +3.76% | +3.63% |
| 2017 | 64,951.4 | 63,077 | +1,874.4 | +2.97% | +2.89% |
| 2018 | 71,117.7 | 68,449 | +2,668.7 | +3.90% | +3.75% |
| 2019 | 75,034.3 | 72,255 | +2,779.3 | +3.85% | +3.70% |
| 2020 | 77,790.6 | 75,110 | +2,680.6 | +3.57% | +3.45% |
| 2021 | 85,342.5 | 83,128 | +2,214.5 | +2.66% | +2.59% |
| 2022 | 88,487.1 | 86,372 | +2,115.1 | +2.45% | +2.39% |
| 2023 | 94,564.4 | 92,241 | +2,323.4 | +2.52% | +2.46% |
| 2024 | 100,868.8 | 98,521 | +2,347.8 | +2.38% | +2.33% |
| 2025 | 105,752.5 | 103,682 | +2,070.5 | +2.00% | +1.96% |
Every generation figure is the 发电量 row of the energy-products table in that year’s national communiqué. Every consumption figure is the 全社会用电量 of the January NEA release. One source each per year, listed below.
| Year | Generation source (read 2026-10-14) | Consumption source (read 2026-10-14) |
|---|---|---|
| 2015 | NBS, published 2016-02-29 | NEA, published 2016-01-15 |
| 2016 | NBS, published 2017-02-28 | NEA, published 2017-01-16 |
| 2017 | NBS, published 2018-02-28 | NEA, published 2018-01-22 |
| 2018 | NBS, published 2019-02-28 | NEA, published 2019-01-18 |
| 2019 | NBS, published 2020-02-28 | NEA, published 2020-01-20 |
| 2020 | NBS, published 2021-02-28 | NEA, published 2021-01-20 |
| 2021 | NBS, published 2022-02-28 | NEA, published 2022-01-17 |
| 2022 | NBS, published 2023-02-28 | NEA, published 2023-01-18 |
| 2023 | NBS, published 2024-02-29 | NEA, published 2024-01-18 |
| 2024 | NBS, published 2025-02-28 | NEA, published 2025-01-20 |
| 2025 | NBS, published 2026-02-28 | NEA, published 2026-01-17 |
The gap was widest in 2015, at 4.70% of consumption, and narrowest in 2025 at 2.00%; in absolute terms it ran from 1,874.4 亿千瓦时 in 2017 to 2,779.3 in 2019. The ratio falls in eight of the ten year-on-year steps; 2018 rises 0.93 points to 3.90%, in a year when consumption grew 8.5% and generation 7.7%, and 2023 rises 0.07 points. The wide end sits in the slowest year here, 2015 (consumption grew 0.5%, generation 0.3%); the narrow end in 2025, the first year in this table above 10 trillion kWh. Consumption grows faster than generation across the decade, 87% against 82%; no document I read connects these moves to the gap itself.
What each number is
Generation (NBS). The value sits in the communiqué’s 主要能源产品产量 table, with coal, crude oil and gas. The 2025 edition prints it as 105,752.5 亿千瓦时 with growth of 4.8%, split into thermal 63,271.5, hydro 14,616.7, nuclear 4,852.3, wind 11,279.2 and solar 11,732.4. Those five add to 105,752.1, four tenths under the row’s own total, and the four low-carbon categories add to 42,480.6 against the communiqué’s separate clean-generation line of 42,481 (NBS, 2026-02-28). Neither the split nor the row carries a footnote defining its scope.
Consumption (NEA). The agency publishes 全社会用电量, electricity used by the whole of society, split four ways: primary, secondary and tertiary industry, and urban and rural households. For 2025 it prints 1,494, 66,366, 19,942 and 15,880 亿千瓦时, which add to 103,682 (NEA, 2026-01-17). An earlier annual release defines the indicator as 全口径数据, full-scope data, as against the dispatch-scope figure used elsewhere (NEA, 2022-01-26).
The two publications run on different clocks.
| Year | NEA consumption release | NBS communiqué |
|---|---|---|
| 2015 | 2016-01-15 | 2016-02-29 |
| 2016 | 2017-01-16 | 2017-02-28 |
| 2017 | 2018-01-22 | 2018-02-28 |
| 2018 | 2019-01-18 | 2019-02-28 |
| 2019 | 2020-01-20 | 2020-02-28 |
| 2020 | 2021-01-20 | 2021-02-28 |
| 2021 | 2022-01-17 | 2022-02-28 |
| 2022 | 2023-01-18 | 2023-02-28 |
| 2023 | 2024-01-18 | 2024-02-29 |
| 2024 | 2025-01-20 | 2025-02-28 |
| 2025 | 2026-01-17 | 2026-02-28 |
NEA publishes the series month by month too, two to four weeks after the month closes (1–11月 2025, NEA, 2025-12-26); the annual figure is the January release of the following year. NBS publishes its generation number monthly too, under a different label.
NBS prints a second, smaller generation number. The monthly release 能源生产情况 reports 规上工业发电量, generation by industrial enterprises above a designated size — 94,181 亿千瓦时 in 2024 (NBS, 2025-01-17), and for 2025 it is 97,159 亿千瓦时 (NBS, 2026-01-19). The communiqué’s totals for those years are 100,868.8 and 105,752.5, so the monthly figure sits 6.6% below the annual one in 2024 and 8.1% below it in 2025, and below NEA’s consumption for both years, by 4,340 and 6,523 亿千瓦时. Which NBS generation number a reader picks decides the sign of the comparison.
Where the difference comes from
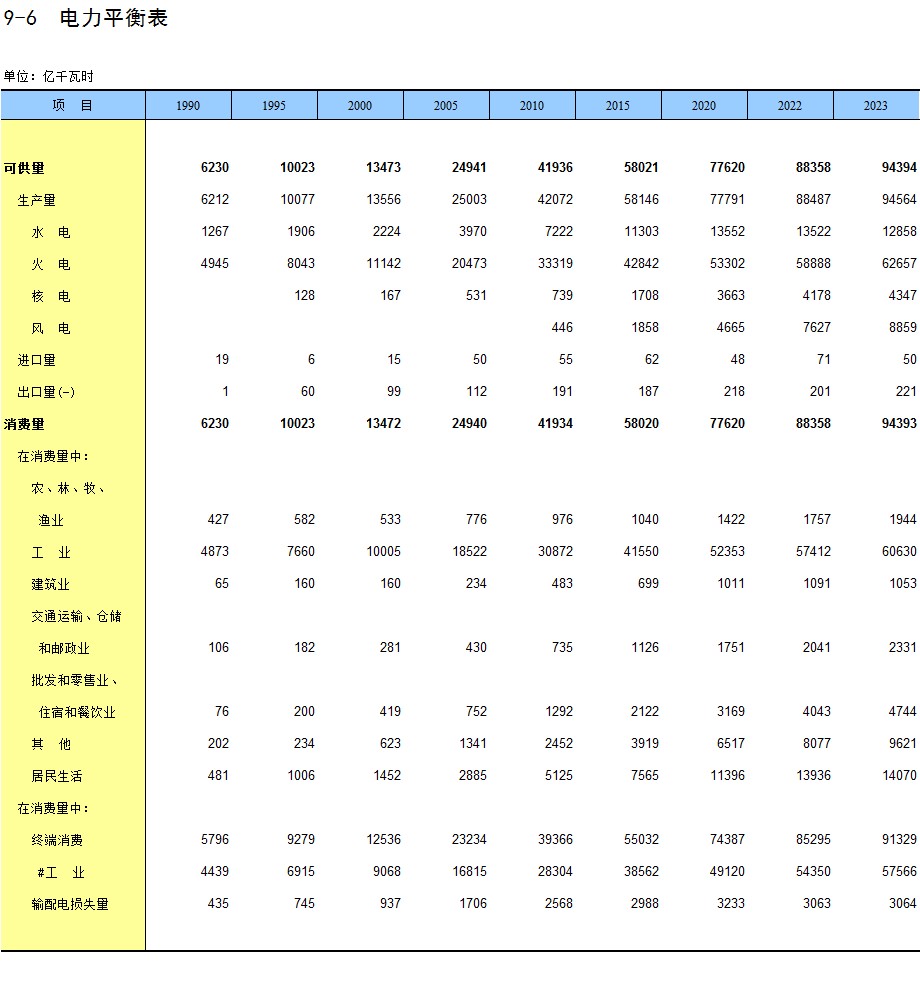
Line losses are inside consumption and outside generation. The yearbook’s electricity balance sheet, table 9-6 of China Statistical Yearbook 2025, in 亿千瓦时, carries rows for 可供量, 生产量, 进口量, 出口量, 消费量, the sector split of consumption, 终端消费 and 输配电损失量 (table 9-6, image, read 2026-10-14). Transmission and distribution losses appear as a row within consumption, not as a deduction from production: for 2023 its 消费量 of 94,393 splits into 终端消费 91,329 and 输配电损失量 3,064, which add to it.
NEA prints a loss rate in the same place, and it falls in every year I could read it: 6.6% in 2015 (NEA, 2016-01-15), 6.47% in 2016 (NEA, 2017-01-16), 6.4% in 2017 (NEA, 2018-01-22), 6.21% in 2018 (NEA, 2019-01-18), 5.9% in 2019 (NEA, 2020-01-20), 5.62% in 2020 (NEA, 2021-01-20), 5.26% in 2021 (NEA, 2022-01-26), 4.84% in 2022 (NEA, 2023-01-18), 4.54% in 2023 (NEA, 2024-01-26) and 4.37% in 2024 (NEA, 2025-01-21). That is a fall of about a third across the decade.
The balance sheet’s own consumption total is higher than the industry’s. For 2023 the table gives 生产量 94,564, 进口量 50, 出口量 221 and 消费量 94,393 亿千瓦时. Those four fit the identity: 94,564 + 50 − 221 = 94,393. The 生产量 figure matches the communiqué’s 发电量 for 2023, 94,564.4, within the table’s rounding. But NEA’s consumption for the same year is 92,241. The balance sheet says the country consumed 94,393; the electricity industry says 92,241. The difference, 2,152 亿千瓦时, is 2.3% of the industry figure, and it splits: 3,064 of it is the loss row, less 912, the amount by which NEA’s total sits above the table’s own 终端消费 of 91,329. Plant own-use is not in that split — the balance sheet has no 厂用电 row, and its columns close without one.
Scope. The chapter note says the energy chapter’s coverage is 全社会, the whole of society, and its tables come from the annual energy balance sheets (China Statistical Yearbook 2025, chapter 9 note, read 2026-10-14). NBS’s consultation channel answers that the balance sheet’s 生产量 and the industrial chapter’s 发电量 are one indicator (NBS consultation reply, submitted 2024-04-03, answered 2024-04-09). The monthly series is narrower by construction, above-scale industrial enterprises only — which explains the direction of that difference, not what the annual 发电量 includes.
Cross-border trade. The balance sheet’s 进口量 and 出口量 rows for 2023 are 50 and 221 亿千瓦时, a net export of 171, or 0.2% of generation.
Two products, six weeks apart. NBS’s January 2024 energy release reported 2023 规上工业发电量 of 8.9 万亿千瓦时 (NBS, 2024-01-17), NEA’s January 2024 release quoted NBS for 89,091 亿千瓦时 (NEA, 2024-01-18), and the communiqué printed 94,564.4 six weeks later. Whether that 6% move is a change of scope, a revision or two products never meant to match, no document I found states.
The growth rates do not fit the levels
NEA prints a growth rate beside each annual figure. It equals the ratio of the two printed levels in three of the ten steps the table can check — 2017, 2018 and 2024. The other seven miss, by 0.10 points in 2023 and by 1.66 points in 2016, where the release prints +5.0% and the levels between them give +6.66%. Every NBS communiqué prints the same rate as its 电力消费量 growth figure, year for year and to the decimal (NBS, 2026-02-28), and the communiqué’s source note attributes 电力消费量 to the China Electricity Council, not to NEA. No note I found states the basis for the rate, and the rates beside the levels in my table are not their ratio.
Method
- Unit. Everything is in 亿千瓦时, 100 million kWh, as printed, and I converted nothing; the opening’s TWh figures are that unit × 0.1. Communiqués up to 2020 label the unit 亿千瓦小时.
- One vintage. Each generation value is from the communiqué published the February after the year; each consumption value from the NEA release published that January. No value came from a later revision, and no series is restated to a common vintage.
- Derived numbers. The gap is column 2 minus column 3. The percentages are gap ÷ consumption × 100 and gap ÷ generation × 100, computed on the unrounded printed values and then rounded to two decimals. The decade changes, +82% and +87%, are the 2025 level ÷ the 2015 level − 1.
- The balance sheet is an image. Table 9-6 is a JPEG; the 2023 column was read twice — a vision pass over the whole table, a tesseract pass over a threefold enlargement, a cropped re-read — and the passes agree: 91,329 + 3,064 = 94,393 holds exactly in the six columns from 2005 on, is off by one in the three earlier ones, and 94,564 + 50 − 221 = 94,393 holds in 2023. Only the 2023 column is quoted; the 2021 and 2022 NEA rate tables are images too, read the same way.
- What I left out. The yearbook prints its own electricity series, the monthly 规上工业 series is published every month, and CEC publishes a full annual report; I used none of them here. Mixing one agency’s revised series with another’s first print describes the comparison, not the country.
What I could not check
- The size of plant own-use (厂用电). The balance sheet has no row for it and closes without one, so the two consumption totals give no handle on it. No NEA release I read prints its value.
- Whether the annual 发电量 equals CEC’s full-scope generation. The values and growth rates line up, but no document I reached names the two as one series, and CEC’s site gave me no readable table.
- Why the monthly and annual NBS generation figures differ by 6% to 8%. The label 规上工业 explains the direction, not the size.
- Whether the 2023 move from 8.9 trillion to 94,564.4 is a revision or a difference of scope. The two documents are six weeks apart and both are official.
- The base behind NEA’s growth rates. The printed rates and the printed levels disagree in seven of the ten checkable steps, and no note explains the basis.
- The 2025 annual statistics release. I could not reach it, so I do not know whether it still carries the 全国线路损失率 row the 2015 to 2024 tables carry.
- Why the loss volume and the loss rate disagree. The yearbook’s 3,064 亿千瓦时 for 2023 is 3.2% of its own consumption for that year, while NEA’s rate for 2023 is 4.54%. No note I found puts the two on one base.