Data and the world Sources and methodOpen data
Births counted three ways, and none agree
China counts births as a sample estimate, as hospital live births, and six years later as school enrolment. The three series disagree by up to 3.4m.
Living page — numbers read from the sources on 2026-10-14, re-checked yearly.
For 2016 there are two official birth counts: 17.86 million, from the statistics bureau, and 18.46 million, from the health ministry. The following January a health-ministry official put both figures in one sentence, said they differed, and named the points of agreement: the growth trend, the birth-order mix, the fertility read (transcript, 2017-01-22, retrieved 2026-10-14).
Six years later a third count arrives. In autumn 2022, 17.01 million children started primary school (2022 bulletin, 2023-07-05). In autumn 2023, 18.78 million did (2023 bulletin, 2024-10-24).
Every figure below was read on 2026-10-14 (CST).
The figure is one PNG, births-three-ways.png (2880 × 2700), and it can be read without the picture; the rows behind it are in births-three-ways.csv with the rendering script make_figure_births.py. Figure and data: CC BY 4.0.
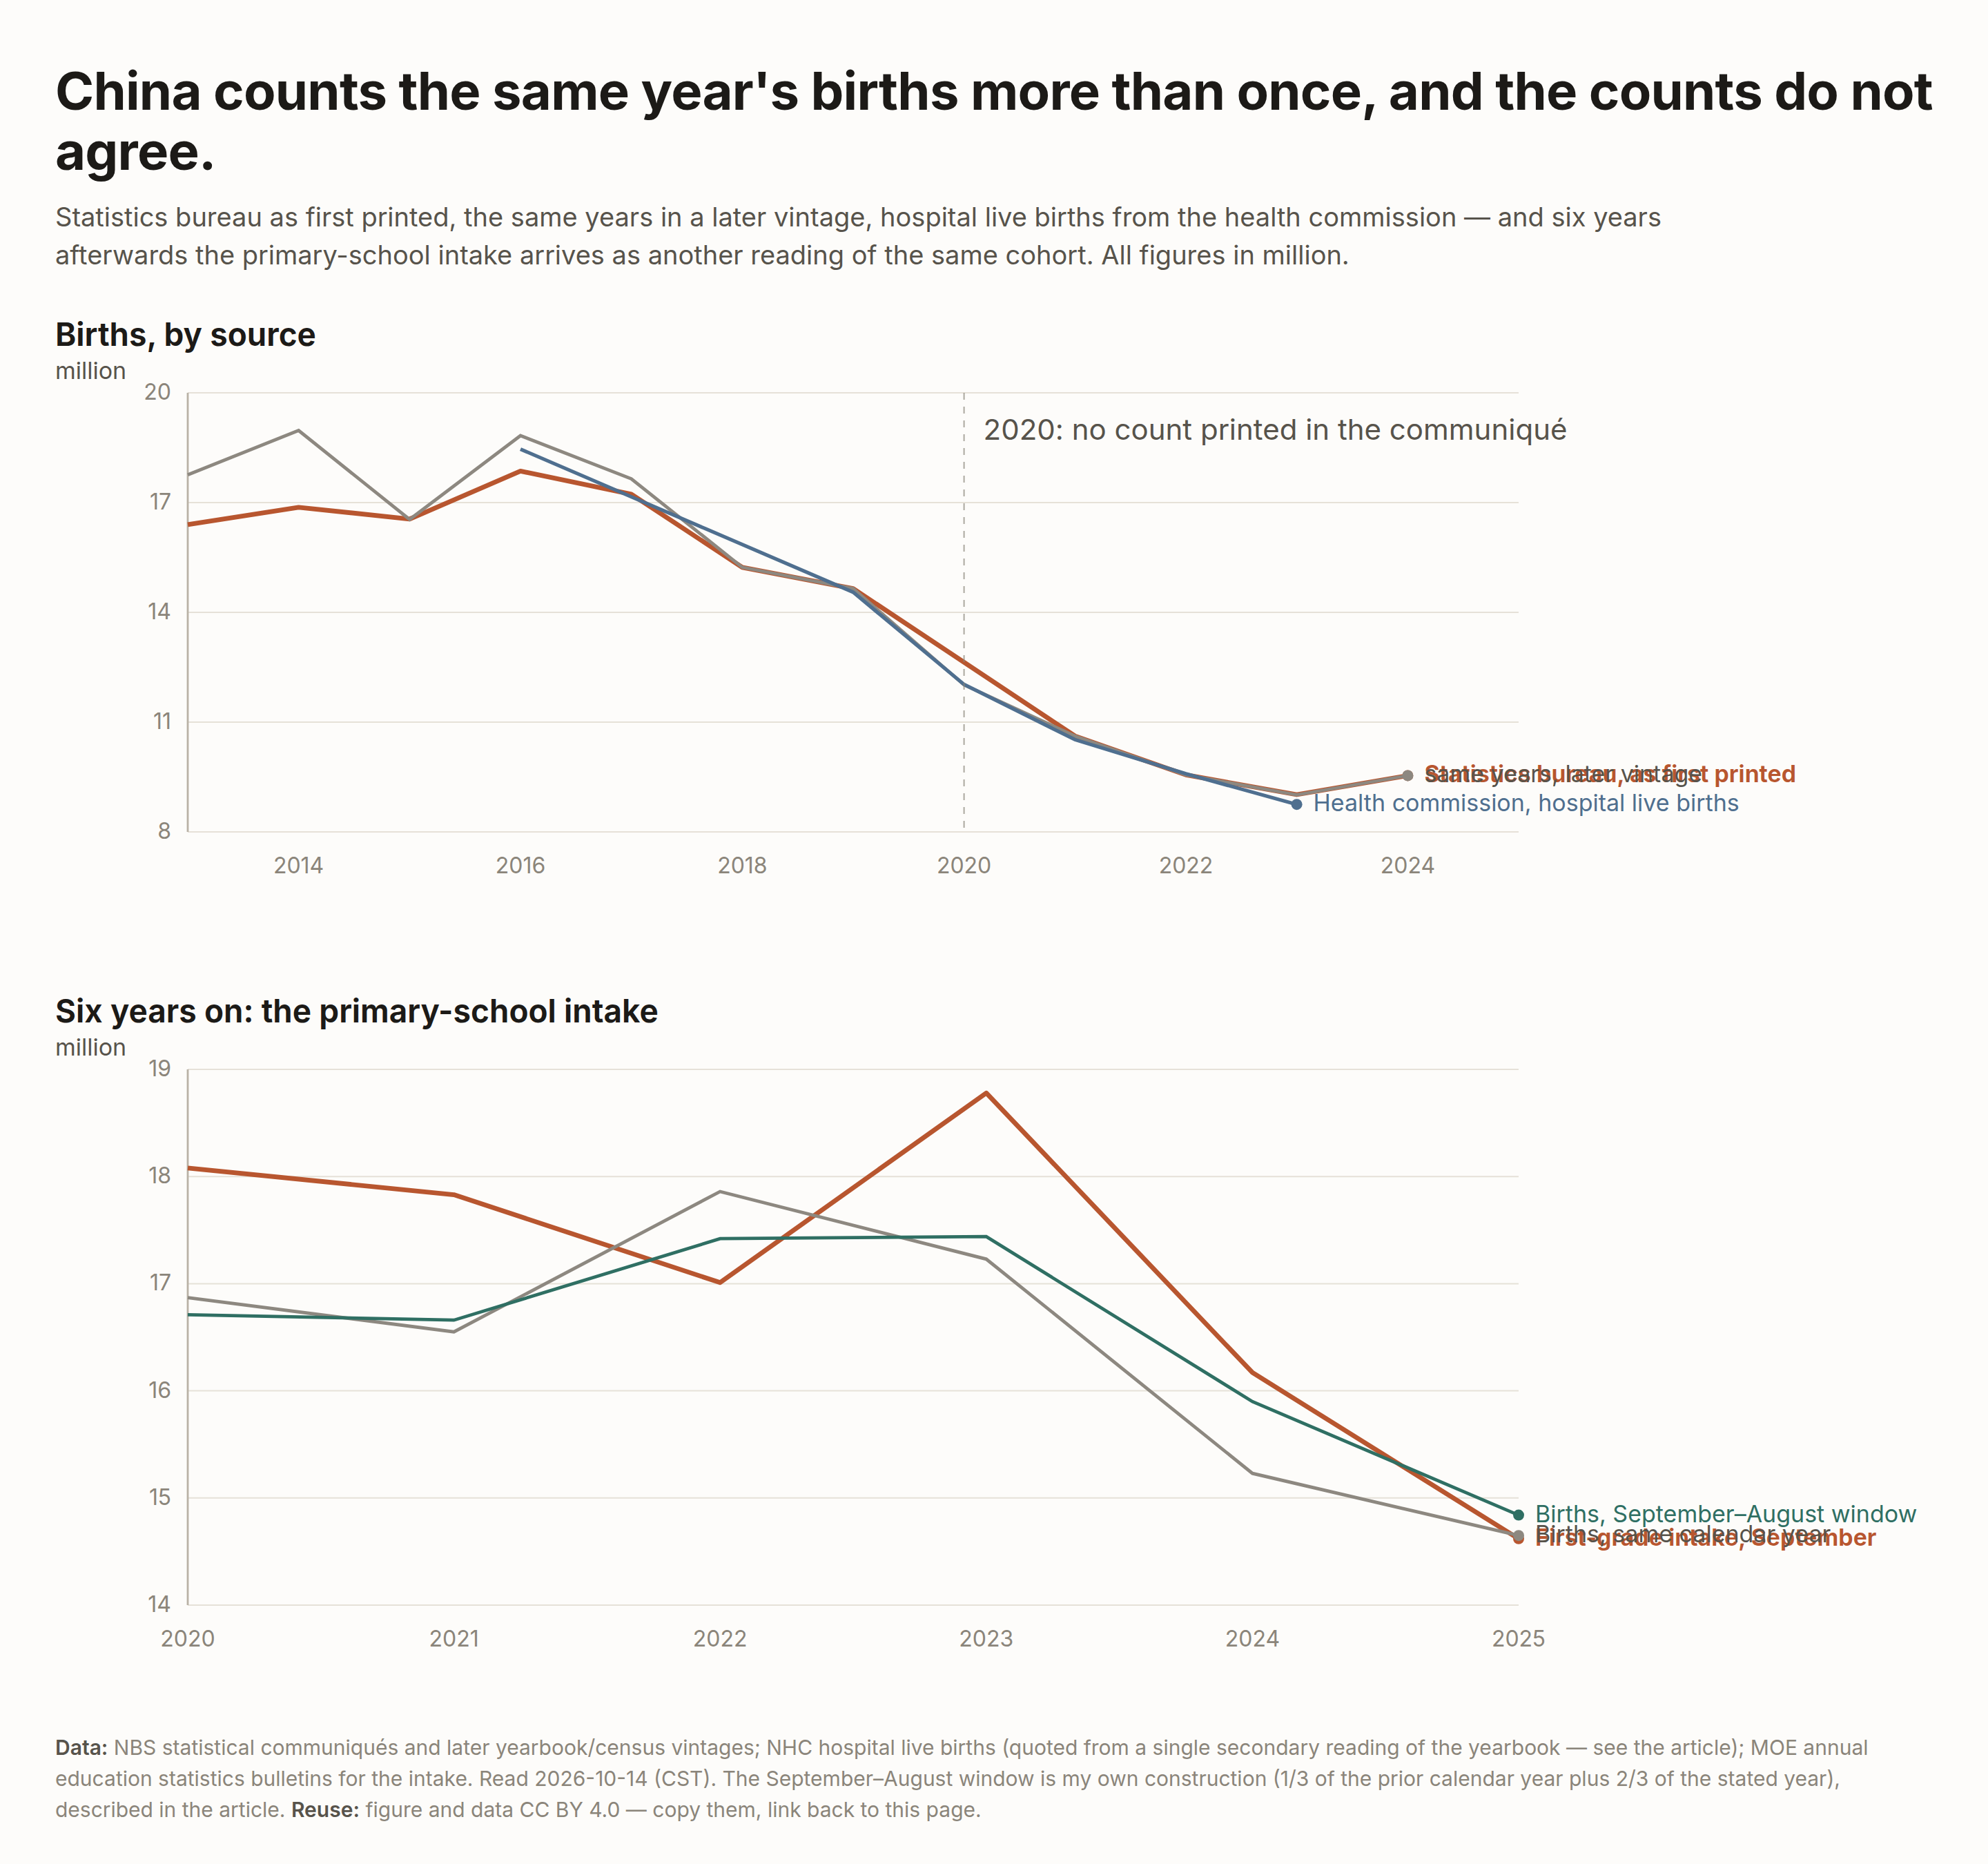
One year, three numbers
Births in millions. Column 1 is printed in that year’s communiqué; column 2 is nowhere printed — it is my arithmetic (Method). The health column has no 2013–2015 values in the sources reached.
| Year | Statistics bureau, as first printed | Statistics bureau, later vintage | Health commission, hospital live births |
|---|---|---|---|
| 2013 | 16.40 | 17.76 | — |
| 2014 | 16.87 | 18.97 | — |
| 2015 | 16.55 | 16.54 | — |
| 2016 | 17.86 | 18.83 | 18.46 |
| 2017 | 17.23 | 17.65 | — |
| 2018 | 15.23 | 15.23 | — |
| 2019 | 14.65 | 14.65 | 14.55 |
| 2020 | no figure printed | 12.02 | 12.03 |
| 2021 | 10.62 | 10.62 | 10.52 |
| 2022 | 9.56 | 9.56 | 9.59 |
| 2023 | 9.02 | 9.01 | 8.75 |
| 2024 | 9.54 | 9.54 | — |
Column 1 is from the annual communiqués.
The 2025 communiqué prints 7.92 million, outside the table (2026-02-28).
Column 3: 18.46 million for 2016 is the commission’s own figure, given at the briefing and repeated in its note on the 2016 bulletin — a page that refused me with HTTP 412, so it rests on the transcript and a search index. The 2019–2023 values are the live-birth row of the health yearbook as read by one columnist: 14.55m and 12.03m (2024-07-24), 10.515m and 9.59m (2025-06-01), 8,748,524 for 2023 (2025-10-27). Those five are one secondary source; the yearbook is sold and no edition answered me.
Two shapes matter. Within one agency the same year moves: for 2012 the bureau first printed 16.35m (2012 communiqué, 2013-02-22) against the 19.73m its yearbook vintage now implies — 3.38m, or 21% — apart. 2013 gains 1.36m, 2014 gains 2.10m, 2015 moves 0.01m.
Between the agencies the sign flips. In 2016 the health figure sat 3.4% above the statistics figure. From 2019 to 2022 the two agree within 1%. By 2023 the statistics figure is 3.1% above the health one. A gap that changes sign is not one definition error; it is two mechanisms moving opposite ways.
Who publishes what, and when
Statistics. An annual sample survey, scaled up to the population. The bureau answered this on its consultation page: the communiqué’s population is a year-end estimate, and births and deaths are calendar-year (posted 2026-07-13). After the 2020 census the bureau said its published births had been low in some years, put the census undercount at 0.05%, and said the years between censuses would be revised (NBS, 2021-05-12). A week later its spokesman gave the sizes: 2016 revised from 17.86m to 18.83m, 2017 from 17.23m to 17.65m, about a million a year (2021-05-17) — counts not reprinted in the communiqués, which carry a rate.
Health. Live births reported by delivery institutions, collected monthly at county level, published in a yearbook. The standard: a live birth is a delivery at 28 weeks or more, or 1,000 grams or more where the age is unclear, plus one of four signs of life. The commission’s annual bulletin prints no birth total of its own: the 2023 edition reprints the bureau’s figure and says so, taking only the sex ratio from the live-birth report. Its footnote says the row now comes from the national monthly hospital-delivery report and counts women with and without local registration, while earlier years came from the annual maternal-and-child report, registered women only (third-party index, 2024-12-27). A year’s figures appear an edition or two later.
Schools. Enrolment is a school-record count, published a year or more later and on no fixed date: the 2023 figures on 2024-10-24, the 2024 figures on 2025-06-11 (bulletin index). Primary-level intake for the year beginning September 2025 was 14.62 million (2026-07-06). Children are counted where they attend school, not where the hukou is.
Why the two birth counts cannot match
- A sample against a full count. One is scaled up from a survey and carries sampling error and undercount; the other is a tally from institutions — does every delivering facility report?
- Who is inside the base. The statistics total includes the armed forces on active service and excludes foreigners and residents of Hong Kong, Macao and Taiwan (2025 communiqué, footnote 5). The health count is deliveries in mainland institutions. A woman with no local registration who delivers in a mainland hospital lands in the health count; in the statistics count only if her household is in the sample.
- Different birth definitions. The health standard counts a delivery at 28 weeks and 1,000 grams. A household survey counts what the household reports.
- Revisions on one side only. The statistics series is re-anchored after each census; the health count has no equivalent re-basing. Part of any gap is a revision lag, not a definition.
- A hole in the worst year to have one. The communiqué of February 2021 prints no birth count and no birth rate; its footnote 2 says why, the census results being due that April. I read that page three ways; the word “birth” does not occur on it. For 2020 there is a census figure of 12.00 million (NBS, 2021-05-11), counted to a reference point of 1 November 2020, so the 2020 row cannot be compared with its neighbours.
Reading births back from school enrolment
The law sets the age: six, or seven where conditions do not yet allow it (Compulsory Education Law, art. 11). No national document fixes the cut-off date inside the year; the ministry leaves it to provincial education departments (2017 admissions notice, 2017-02-22).
So the intake in September of year Y is not the calendar-year birth cohort of Y−6. Assume births spread evenly through the year, since I found no monthly national series: with a 31 August cut-off the window is September to December of Y−7 plus January to August of Y−6. Both alignments are defensible and they disagree:
| Intake, September | Enrolment | Cohort, same calendar year | Cohort, Sep–Aug window | Enrolment minus calendar year | Enrolment minus Sep–Aug |
|---|---|---|---|---|---|
| 2020 | 18.08 | 16.87 | 16.71 | +7.2% | +8.2% |
| 2021 | 17.83 | 16.55 | 16.66 | +7.7% | +7.0% |
| 2022 | 17.01 | 17.86 | 17.42 | −4.7% | −2.3% |
| 2023 | 18.78 | 17.23 | 17.44 | +9.0% | +7.7% |
| 2024 | 16.17 | 15.23 | 15.90 | +6.1% | +1.7% |
| 2025 | 14.62 | 14.65 | 14.84 | −0.2% | −1.5% |
Enrolment in millions, from the six bulletins below; cohorts are my arithmetic, percentages on the unrounded enrolments.
| Intake, September | Bulletin | Published |
|---|---|---|
| 2020 | 2020 bulletin | 2021-08-27 |
| 2021 | 2021 bulletin | 2022-09-14 |
| 2022 | 2022 bulletin | 2023-07-05 |
| 2023 | 2023 bulletin | 2024-10-24 |
| 2024 | 2024 bulletin | 2025-06-11 |
| 2025 | 2025 bulletin | 2026-07-06 |
The window alone moves the same row 0.7 to 4.4 points, most in 2024: from +6.1% to +1.7%.
The bigger term is the birth vintage. Rebuild the cohorts from the revised series and the 2020 gap falls from +8.2% to −2.6%, 2021 from +7.0% to +2.7%, 2022 widens from −2.3% to −5.8%, 2023 from +7.7% to +4.1%. Across six intake years and two vintages the window alignment runs −5.8% to +8.2%; the calendar-year alignment is wider: −9.7% in 2022, +9.0% in 2023. That spread is my error bar, and it is the number to carry, not any single cell.
Three smaller terms, each an estimate I could not source:
- Repeaters and delayed entry. Children who started late or were held back enter with a later cohort and inflate the intake. No national figure is published; under 2%, my judgement.
- Children who never enrol. The education ministry’s nine-year retention measure — grade-9 graduates as a share of the same group on entry to grade 1 — was 96.1% for 2025 (2025 bulletin, footnote 4). That is attrition over nine years, not at the door, so the intake-side loss is smaller; under 2%.
- Movement. Children who move between provinces are counted where they enrol, so the national total nets out; a province’s own enrolment would not. The 2025 bulletin counts 8.62m primary pupils registered in a rural area of another county or province who moved with working parents.
Method
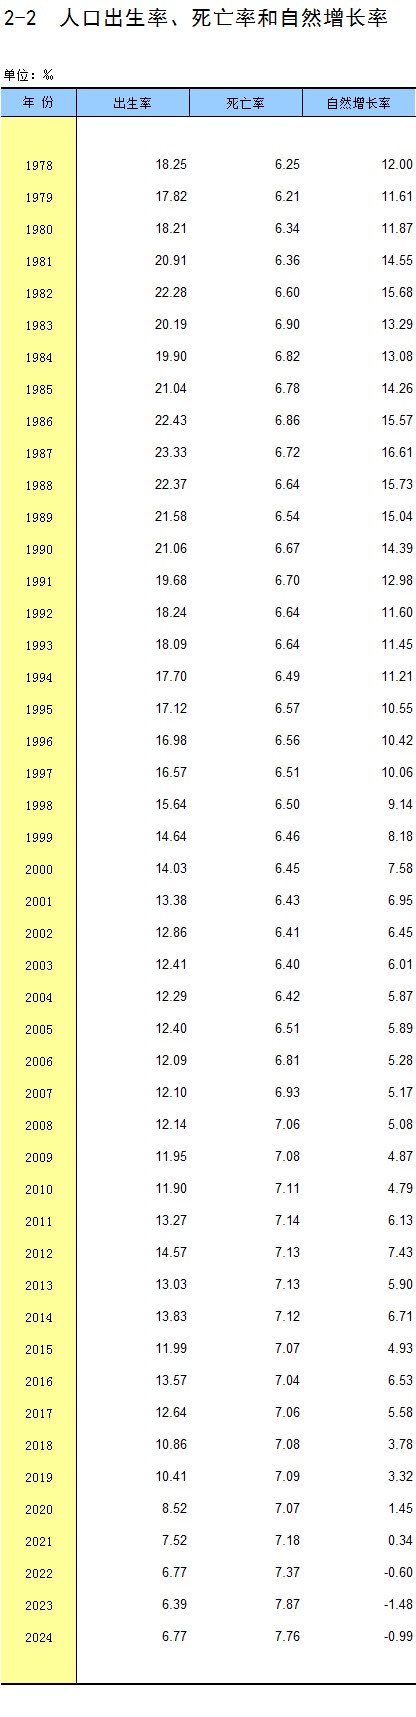
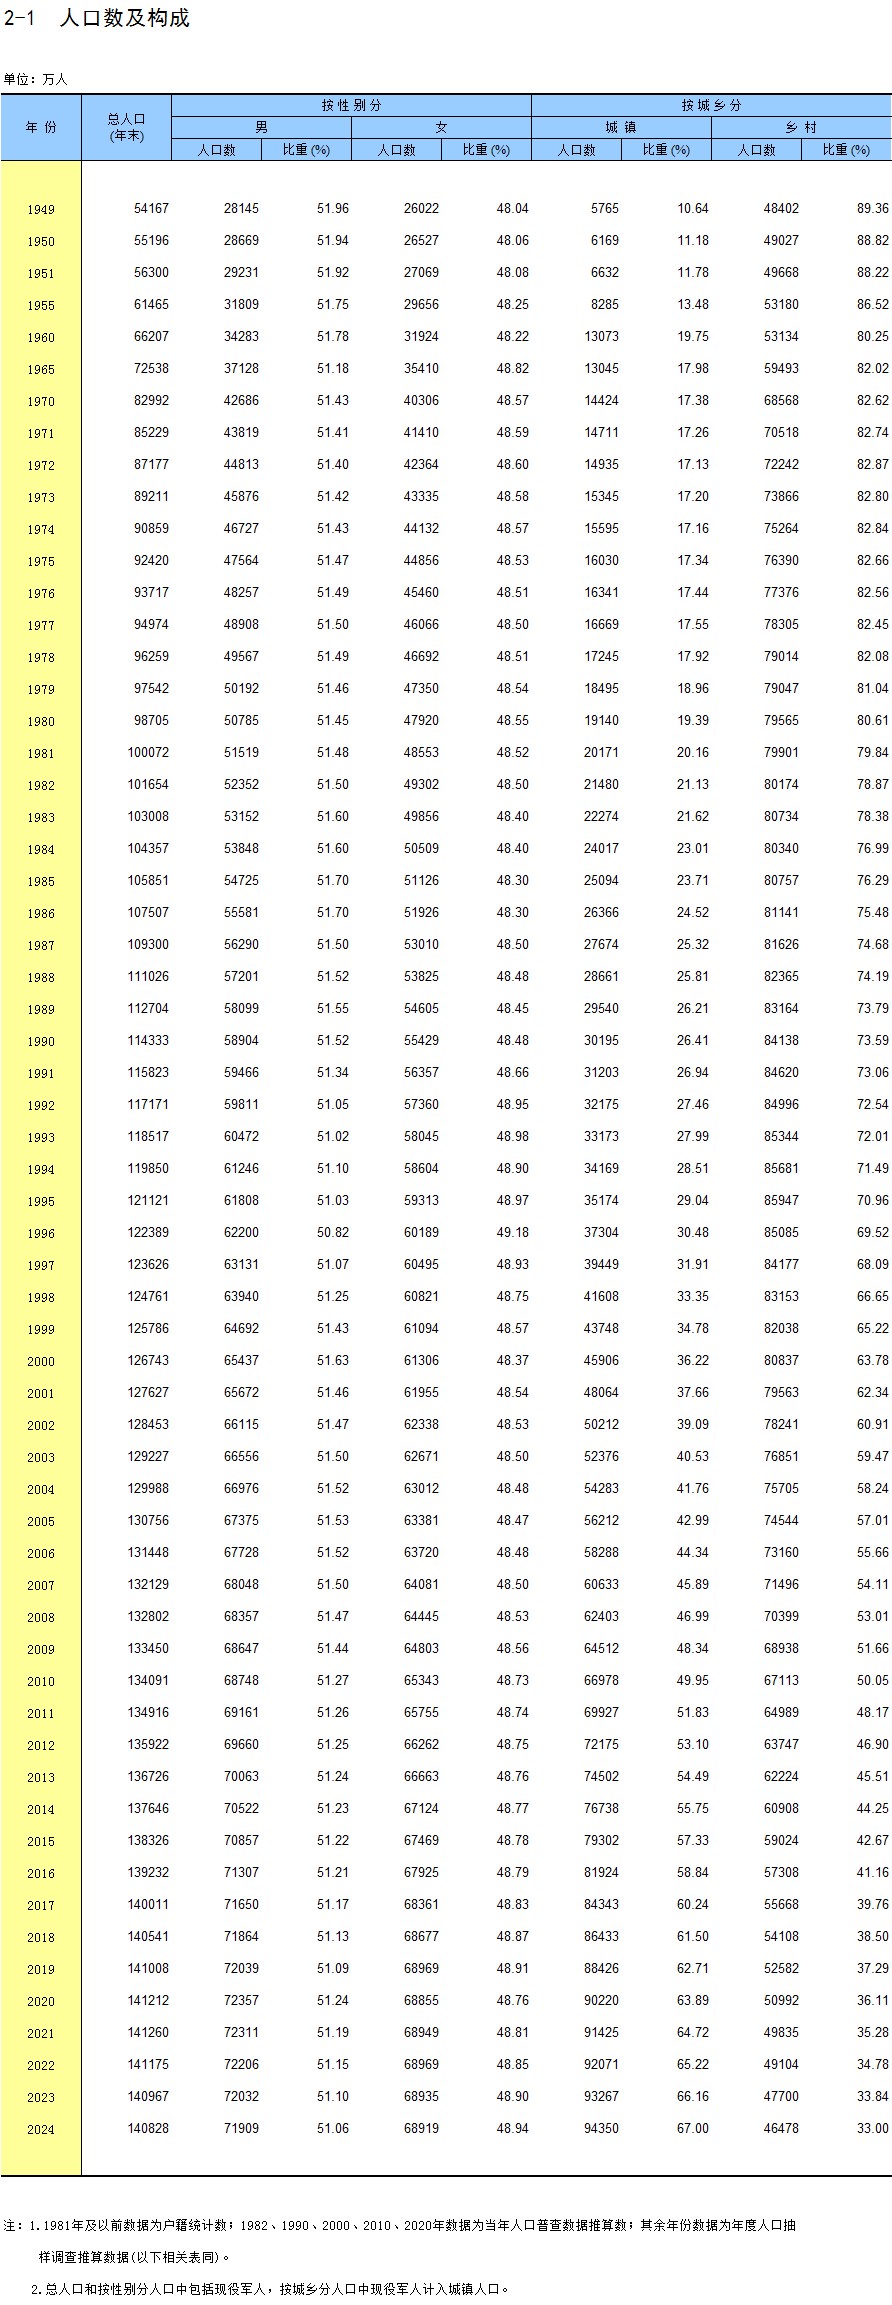
- What each number is. The statistics column is read from the communiqués linked above. The “later vintage” column is my arithmetic, not a published count: the bureau republishes an annual birth rate (table 2-2) and year-end populations (table 2-1), and a count is the rate times the average of two year-end populations. Each rate is printed to two decimals, so a derived count carries about 7,000 births of rounding, the size of the 2015 move. The method reproduces both figures the spokesman quoted, 18.83m for 2016 and 17.65m for 2017.
- Two reads. Both yearbook tables are images; I read the rows used here twice, two readings that agree on every row.
- Enrolment. Primary-level intake only, and not ordinary primaries alone: children in ordinary primary schools, teaching points, the primary sections of nine- and twelve-year schools and attached primary classes (2025 bulletin, footnote 11). Special-education intake, 164,400 in 2025, is separate.
- Retrieval, 2026-10-14, CST. Statistics pages and education bulletins served directly. The bureau’s data portal serves its home page but answered the query endpoint with HTTP 403, so the yearbook tables are my route to the revised series. The health commission’s site answered HTML with HTTP 412 — proxy, direct, a second user agent, a reader service — while its PDFs served, which is how its 2023 bulletin is cited. No health-commission HTML page was read at source.
What I could not check
- The five yearbook live-birth values, 2019 to 2023. One columnist’s reading of a sold yearbook. No second independent source found.
- Whether the health live-birth series was ever revised. No revision notice found, and no statement that it is never revised.
- The reporting change itself. The footnote says earlier years covered registered women only but not which year the switch happened, so I cannot say which rows are comparable — and I read it on a third-party page.
- The cut-off dates provinces chose. The law fixes the age and the ministry leaves the date to the provinces; I did not collect the provincial rules. The Sep–Aug window is my construction on an assumed even spread.
- Calendar year or November to October. The bureau’s consultation answer puts the annual series on calendar years; the census figure of 12.00 million for 2020 is tied to 1 November 2020. Unreconciled.
- The 2020 count. No annual figure exists in the series; the census number covers a window ending 1 November 2020.
- Births to women in the armed forces. The population total includes service members; whether the hospital report captures military hospitals, I could not establish.
- Repeater and delayed-entry rates at grade 1. My under-2% figure is a judgement, not a measurement.
- Provincial versions of this method. Cross-province movement makes a provincial enrolment count a poor proxy for births there; I did not test how poor.