Data and the world Open dataTrade and logistics
Port throughput: China's own count and the world's
MOT counts 354.47m TEU at China's ports in 2025; the World Bank's UNCTAD series stops at 299.70m for 2024. The 10% gap is inland ports.
Living page — numbers read from the sources on 2026-10-14, re-checked yearly.
Two counts describe China’s ports and do not agree — mostly over which ports are counted.
The Ministry of Transport’s annual port table puts China’s ports at 1,833,806 万吨 of cargo and 35,447 万TEU of containers for 2025 (MOT table, 2026-01-30; read 2026-10-14). The World Bank’s container series, sourced from UNCTAD, has China at 299,703,800 TEU for 2024, its newest year (World Bank, updated 2026-10-08). MOT’s own figure for 2024 was 33,200 万TEU (2024 table, 2025-03-26). They sit 3,229.6 万TEU apart that year, or 10.8 percent.
MOT’s national figure is its coastal and inland-waterway subtotals added together; the World Bank’s series is maritime container traffic. Set the inland ports aside and the comparison reverses: against MOT’s coastal subtotal, the World Bank is 810.4 万TEU, or 2.7 percent, higher in 2024.
Units: 万吨 = 10,000 tonnes; 亿吨 = 100 million tonnes; 万TEU = 10,000 TEU.
The figure is one PNG, port-throughput-two-sources.png (2880 × 2654), and it can be read without the picture; the rows behind it are in port-throughput-two-sources.csv with the rendering script make_figure_port_throughput.py. Figure and data: CC BY 4.0.
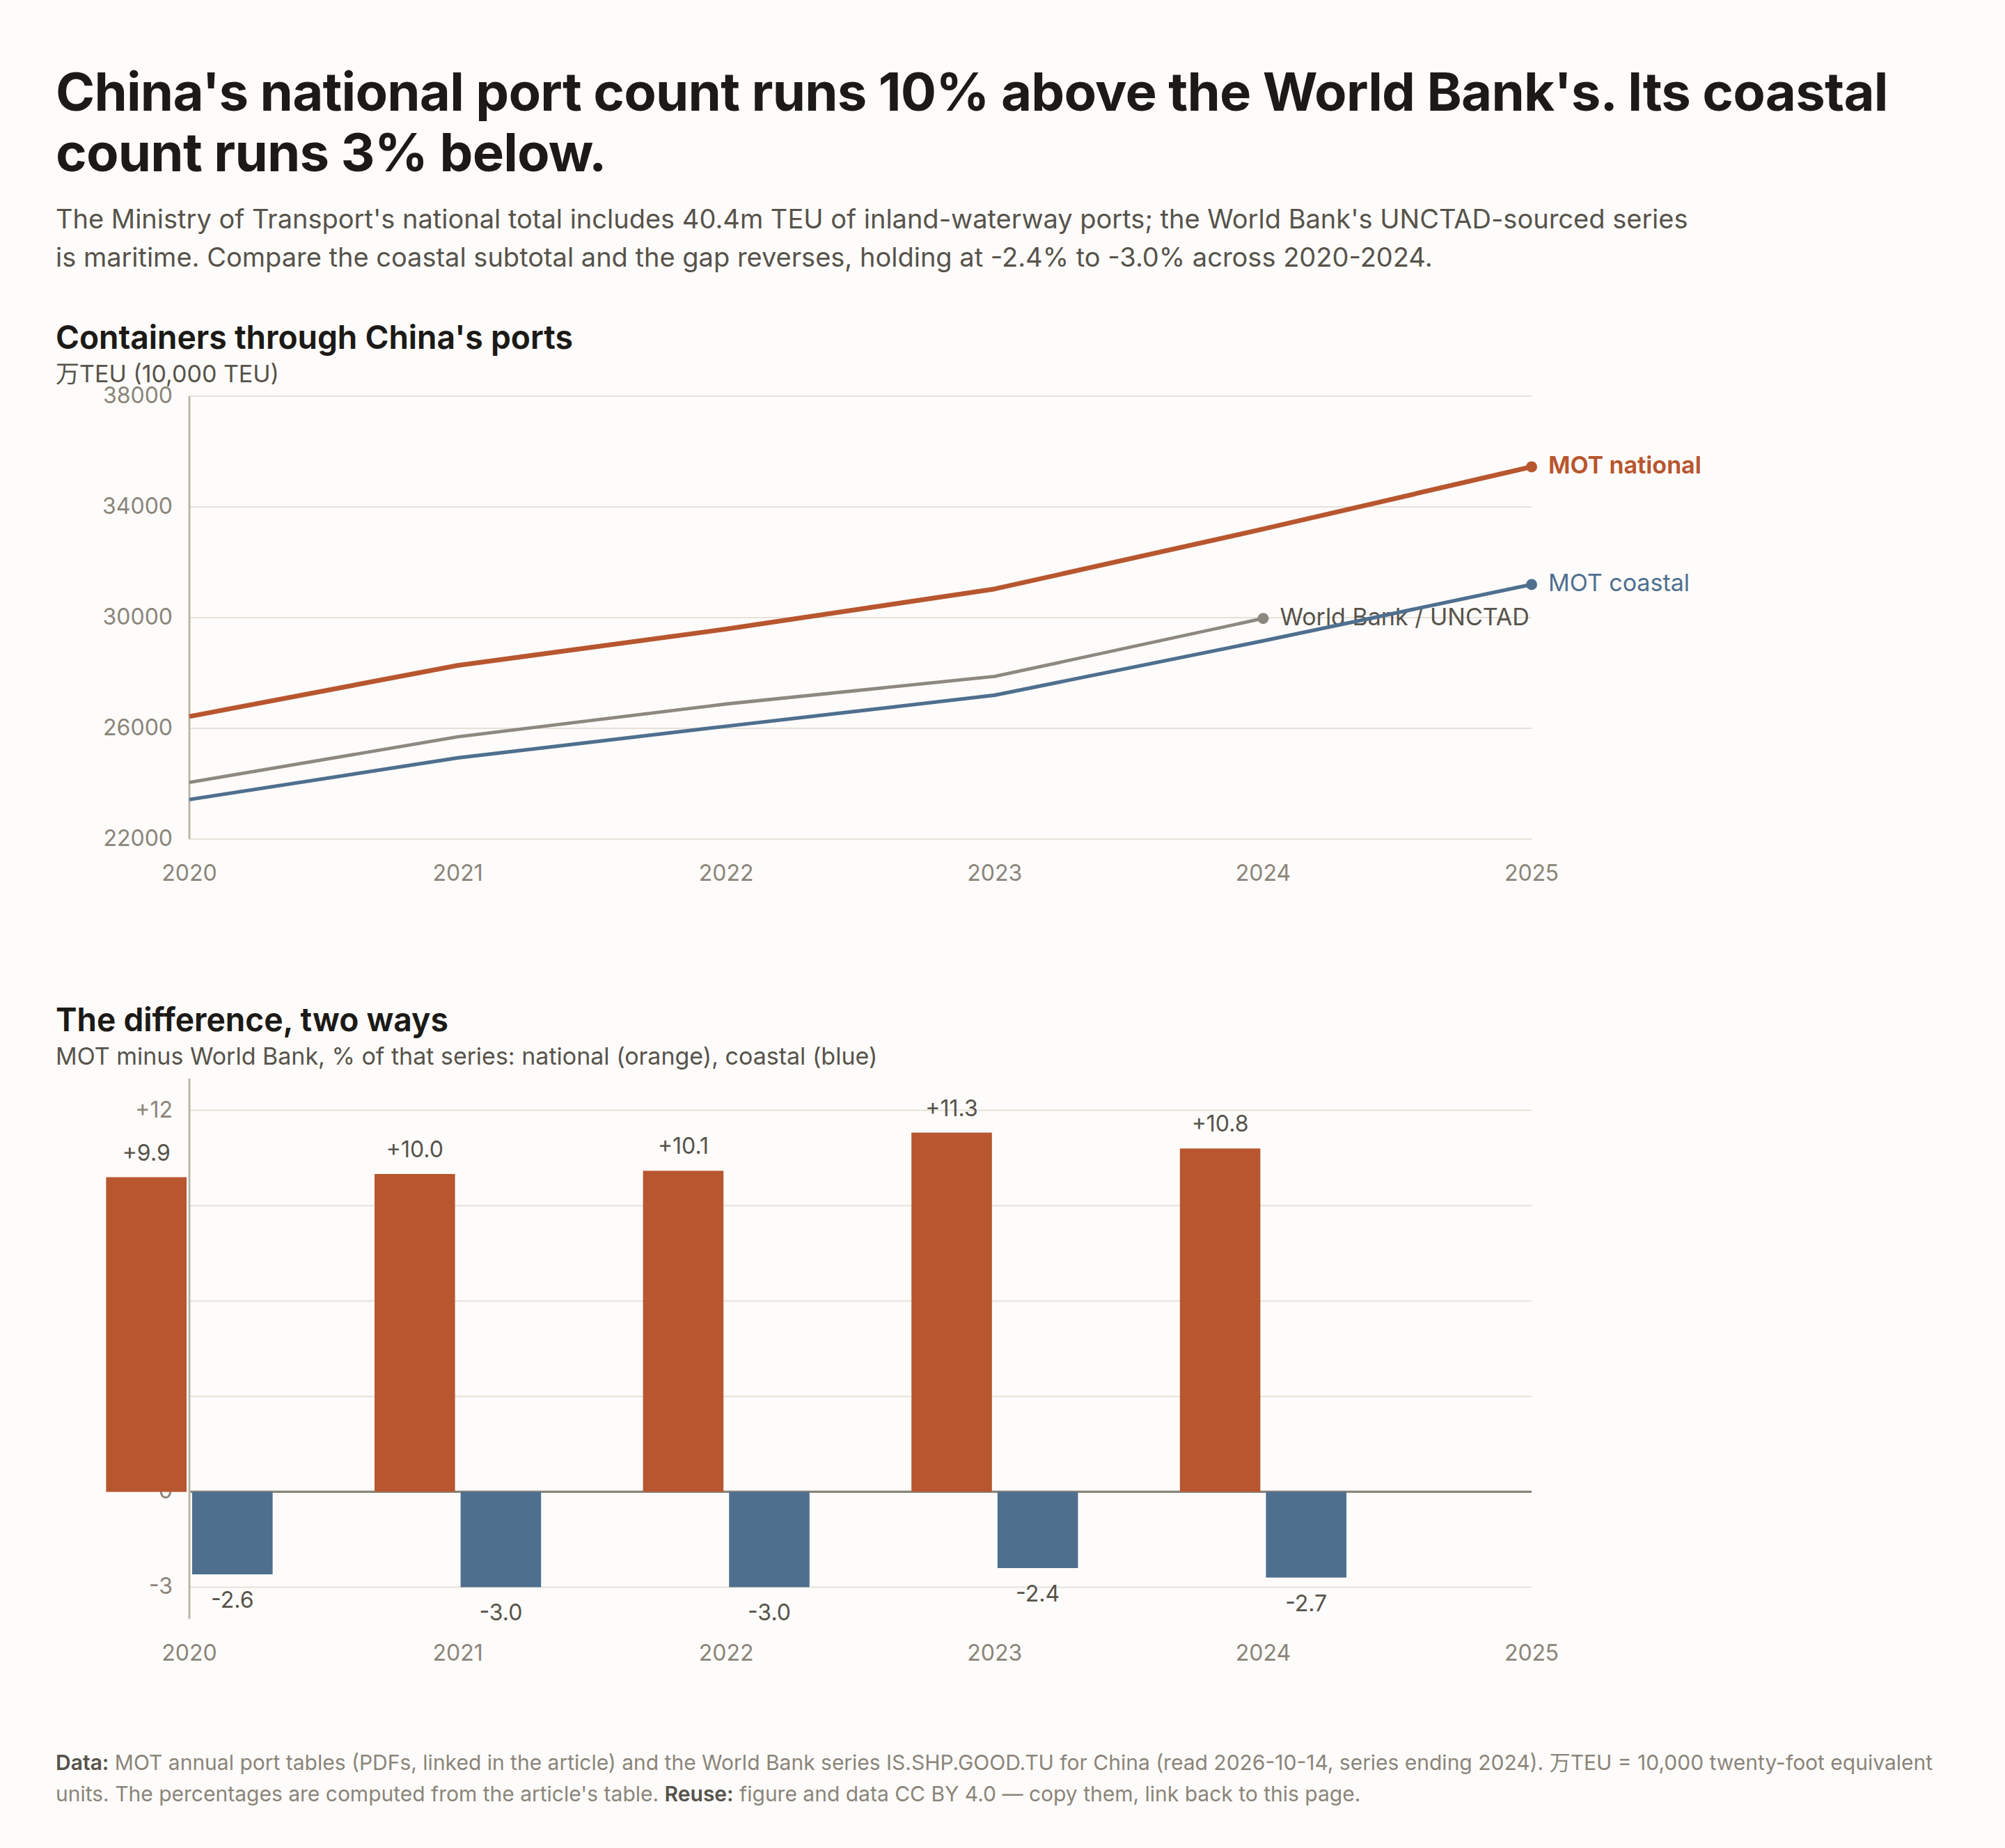
Containers, 2020 to 2025
| Year | MOT national (万TEU) | Coastal (万TEU) | Inland (万TEU) | World Bank (万TEU) | MOT − World Bank (万TEU) | Gap | MOT growth | World Bank growth |
|---|---|---|---|---|---|---|---|---|
| 2020 | 26,430 | 23,429 | 3,001 | 24,048.0 | +2,382.0 | +9.9% | +1.2% | +1.2% |
| 2021 | 28,272 | 24,933 | 3,340 | 25,694.6 | +2,577.4 | +10.0% | +7.0% | +6.8% |
| 2022 | 29,587 | 26,073 | 3,515 | 26,879.0 | +2,708.0 | +10.1% | +4.7% | +4.6% |
| 2023 | 31,034 | 27,196 | 3,839 | 27,876.0 | +3,158.0 | +11.3% | +4.9% | +3.7% |
| 2024 | 33,200 | 29,160 | 4,040 | 29,970.4 | +3,229.6 | +10.8% | +7.0% | +7.5% |
| 2025 | 35,447 | 31,198 | 4,248 | — | — | — | +6.8% | — |
The like-for-like comparison uses MOT’s coastal subtotal, dropping the inland-waterway ports:
| Year | MOT coastal (万TEU) | World Bank (万TEU) | Coastal − World Bank (万TEU) | Coastal gap |
|---|---|---|---|---|
| 2020 | 23,429 | 24,048.0 | -619.0 | -2.6% |
| 2021 | 24,933 | 25,694.6 | -761.6 | -3.0% |
| 2022 | 26,073 | 26,879.0 | -806.0 | -3.0% |
| 2023 | 27,196 | 27,876.0 | -680.0 | -2.4% |
| 2024 | 29,160 | 29,970.4 | -810.4 | -2.7% |
| Year | MOT table used |
|---|---|
| 2020 | 2021-01-21 |
| 2021 | 2022-01-19 |
| 2022 | 2023-01-30 |
| 2023 | 2024-04-16 |
| 2024 | 2025-03-26 |
| 2025 | 2026-01-30 |
The MOT columns are as printed; the gap columns are mine. In four years the halves miss by one 万TEU, rounding inside MOT’s table.
The two series agree on direction every year and on growth to within 0.2 points in 2020–2022; then they part: +4.9 against +3.7 for 2023, +7.0 against +7.5 for 2024.
Cargo tonnage, 2020 to 2025
| Year | Total (亿吨) | Coastal (亿吨) | Inland (亿吨) | Foreign trade (亿吨) | Domestic (亿吨) |
|---|---|---|---|---|---|
| 2020 | 145.4991 | 94.8002 | 50.6989 | 44.9554 | 100.5437 |
| 2021 | 155.4534 | 99.7259 | 55.7275 | 46.9736 | 108.4798 |
| 2022 | 156.8453 | 101.3102 | 55.5351 | 46.0728 | 110.7725 |
| 2023 | 169.7326 | 108.3471 | 61.3855 | 50.4694 | 119.2632 |
| 2024 | 175.9501 | 112.1780 | 63.7721 | 53.9688 | 121.9813 |
| 2025 | 183.3806 | 116.3392 | 67.0414 | 56.5256 | 126.8550 |
Coastal plus inland equals the total in all six years, and foreign plus domestic does too; the domestic column is my subtraction. MOT’s 2025 bulletin states the same splits rounded, as 沿海 116.34 亿吨, 内河 67.04, 外贸 56.53, 内贸 126.86 (2025 bulletin, 2026-06-22).
No international body publishes a country-level figure for this quantity. UNCTAD’s maritime-freight series puts China at roughly 3.7 billion tonnes in 2024, about 670 million loaded and close to 3.0 billion discharged (UNCTADstat, updated 2026-03-17). MOT’s 2024 total, 17.595 billion tonnes, is about 4.8 times that; the foreign-trade line alone, 5.397 billion, is 1.5 times it. UNCTAD still calls China the leading maritime-freight economy, the sense in which the ministry’s world-leadership claim (Xinhua, 2026-07-11) survives.
What each count covers
The Chinese definition is set centrally, in the reporting system MOT publishes. Its container table covers international-standard boxes completed at berths and buoys inside a port area, converting 45-foot boxes as 2.25 TEU, 40-foot as 2, 20-foot as 1, other sizes as 1 (港口综合统计报表制度, 2017 edition, read 2026-10-14). The text is dated 2017-09, approved as 国统制〔2017〕110 号, forms valid to 2019-09. Four provisions:
- Coastal and inland port areas are counted separately, on different forms, then added.
- Shipper-owned berths sit inside the total, filed again by provinces as public and shipper-dedicated berths.
- Boxes and their contents both count toward tonnage. Container tare weight and the goods inside both go into cargo tonnage, beside the TEU count.
- Inter-port-area waterborne moves are included for merged ports, so cargo between merged areas counts again; scope changes need MOT’s statistical office to approve.
A note in the container table adds that international routes and 内支线, the feeder services, count as foreign-trade volume.
The international side is thinner: the UN’s metadata file for SDG indicator 9.1.2, whose custodian is UNCTAD, says the container data “rely mainly on secondary sources that may vary over time” and that country totals “may conceal the fact that some minor ports are not included”, with port coverage differing between countries (SDG 9.1.2 metadata, last updated 2025-06-11). UNCTAD’s China profile attributes the value to industry publications, terminal operators and port authorities; its 2024 edition still carries a 2023 value (UNCTAD profile). It prints 279,793,800 TEU for 2023; the World Bank copy prints 278,759,834 (World Bank, updated 2026-10-08), with no note on the 1.03 million difference.
Why the gap is mostly one subtraction
The obvious explanation for a 10 percent Chinese excess is inland ports, and the arithmetic supports it.
In 2024 MOT counted 4,040 万TEU inland and 29,160 万TEU coastal against a national 33,200 and a World Bank 29,970.4. The national gap is 3,229.6 万TEU, or 10.8 percent. Drop the inland ports and the sign flips: MOT’s coastal half is 810.4 万TEU below the World Bank.
That residual is steady, -2.4 to -3.0 percent every year from 2020 to 2024, while the national gap runs +9.9 to +11.3. A small, stable difference points to coverage: UNCTAD says coverage differs by country and may omit minor ports, and its China figure sits between MOT’s coastal and national totals. It does not look like a one-sided overcount.
Correction, 2026-10-18: an earlier version called the gap “not all error” and a 32m TEU residue “itemised nowhere”. Wrong: the inland subtotal itemises it, and the like-for-like coastal gap is negative. Figure and text corrected.
The tonnage series shows the same trap. MOT counts each movement into and out of a port area, both directions, domestic as well as foreign. UNCTAD’s maritime freight series excludes domestic maritime transport and transshipment, and attributes volumes to the economy of origin or destination rather than the port of handling (SDG 9.1.2 metadata, last updated 2025-06-11). Two totals for one country can then differ by a factor of nearly five with neither wrong — the trap of reading provincial GDP.
Same port, two numbers
| Item, 2025 | MOT, port area | The operator’s own report |
|---|---|---|
| Cargo (亿吨) | 8.1153, or 81,153 万吨 | 6.0 |
| Containers (万TEU) | 5,506 | 5,506.3 |
The container figures agree: 5,506.3 万TEU from Shanghai’s listed operator, up 6.9 percent, a sixteenth consecutive year at the top (2025 annual report, disclosed 2026-03-31).
The cargo figures do not. MOT’s Shanghai row is 81,153 万吨; the same report puts its home port at 6.0 亿吨, up 3.4 percent. MOT’s number is 35 percent higher, a gap of 2.11 亿吨; a port-area total includes berths the operator does not run, and neither document itemises it.
The statistics office rounds the same number differently: its 2025 communiqué prints 183 亿吨 of port cargo and 35,447 万标准箱 of containers (NBS communiqué, 2026-02-28); MOT prints 1,833,806 万吨 and the same 35,447 万TEU; the tonnage rounding discards 38 million tonnes.
Rankings change with the unit
MOT lists throughput by port area and province. Its 2025 port-area rows alone run Shanghai 5,506; Ningbo-Zhoushan 4,387; Shenzhen 3,541; Qingdao 3,289; Guangzhou 2,768; Tianjin 2,403; Xiamen 1,251; Suzhou 1,021; Beibu Gulf 1,006 — nine port areas above 10 million TEU by my count (2025 table, read 2026-10-14).
Lloyd’s List’s One Hundred Container Ports, for the 2024 data year, leads Shanghai, Singapore, Ningbo-Zhoushan, Shenzhen, Qingdao, Guangzhou, Busan, Tianjin, Jebel Ali and Port Klang, the hundred handling 743.6 million TEU (Lloyd’s List, read 2026-10-14; also at the World Ports Organization, 2025-09-01). Two of MOT’s nine big port areas sit lower on that hundred: Suzhou, an inland-river port area, is 18th, Beibu Gulf 23rd. Each list measures the port unit its publisher defines.
The third list measures time, not volume. The World Bank and S&P Global’s Container Port Performance Index ranks 2024 with Yangshan first at 146.3, Fuzhou second, Dalian fourth, Mawan sixth, Guangzhou eighth, Chiwan ninth, Ningbo tenth, Tianjin fourteenth, Xiamen seventeenth and Yantian nineteenth (CPPI, Table 2.1). Eleven of the twenty rows are China’s, counting Hong Kong SAR. No row is named Shenzhen, whose deep-water areas rank as Mawan, Chiwan and Yantian; the Shanghai row is Yangshan, the operator’s third year at the top (2025 annual report, 2026-03-31).
The dated record
| Date | What an official record says |
|---|---|
| 2010 | First year of Shanghai’s run at the top: the operator and the city each describe 2025 as the sixteenth consecutive year |
| 2023-05-18 | The index’s third edition, ranking 348 ports, puts Yangshan first for the first time (S&P Global) |
| 2024-06-04 | CPPI 2023: Yangshan first for a second year (World Bank) |
| 2024 | Shanghai becomes the first port above 50 million TEU and Hong Kong leaves Lloyd’s List’s top ten after more than half a century (Lloyd’s list, 2025-09-01) |
| 2025-09-23 | CPPI 2020 to 2024: its Table 2.1 puts Yangshan first for 2024 (World Bank) |
| 2026-01-05 | The port’s own announcement, carried by Xinhua, puts Ningbo-Zhoushan above 1.4 billion tonnes of cargo in 2025 and a 17th straight year at the world’s top (Xinhua); the ministry’s table gives that port area 143,192 万吨 (MOT, 2026-01-30) |
| 2026-01-13 | Singapore’s port authority reports a record 44.66 million TEU for 2025, up 8.6 percent (MPA Singapore) |
| 2026-01-30 | MOT’s 2025 port table: 1,833,806 万吨 and 35,447 万TEU, with Ningbo-Zhoushan alone at 143,192 万吨 (MOT) |
| 2026-06-22 | MOT’s 2025 bulletin repeats the totals and adds the coastal, inland, foreign and domestic splits (bulletin) |
| 2026-07-11 | The ministry states that China’s port cargo and container throughput in 2025 ranked first in the world (Xinhua) |
Two 2025 sources settle the container order: Shanghai 55.06 million TEU, Singapore 44.66 million, Ningbo-Zhoushan 43.87 million — Singapore second by 0.79 million.
Update rhythm: across the six years here MOT’s table has arrived between 19 January and 16 April, most recently 30 January; the bulletin follows in June; the World Bank series showed 2024 as newest on its 2026-10-08 update.
Method
- Sources. MOT’s annual port tables, read as text; MOT’s bulletins; the NBS communiqués; the World Bank indicator (API matching its data page); UNCTAD’s China profile and insights page; the UN metadata file for SDG 9.1.2; the operator’s annual report; both index reports.
- Arithmetic. Gap columns, gap percentages, the tonnage ratios and the count of port areas above 10 million TEU are mine, on the roundings the sources print; I adjusted no printed figure.
- Dates. Each MOT table’s date is the 公开日期 on its disclosure page, not the file name.
- Vintages. Each MOT value is the one printed in that year’s table; the World Bank series is one snapshot across all years, where UNCTAD’s profile differs.
- Retrieval. All reads on 2026-10-14, China Standard Time; the MOT PDFs rendered as text. UNCTAD’s dataviewer returned no text, so its wording comes from the UN metadata file.
What I could not check
- The port list inside UNCTAD’s China number. No port-level breakdown is published, so the residual between MOT’s coastal-only figure and UNCTAD’s cannot be attributed.
- The 2.11 亿吨 between MOT’s Shanghai row and the operator’s home-port figure. The categories point at non-operator berths; neither document itemises it.
- Whether the feeder rule applies to tonnage. The note adding feeder services to foreign-trade volume sits in the container table; I read no equivalent for the cargo forms.
- Ningbo-Zhoushan’s rank as the world’s largest cargo port. The 143,192 万吨 is MOT’s. The “17th consecutive year” is the port’s own announcement, carried by Xinhua; no international series ranks cargo ports, since the container lists are container-only and UNCTAD’s freight series is attributed to trading economies.
- The two 2023 container values published by UNCTAD. Its profile prints 279,793,800 TEU; the World Bank copy prints 278,759,834. No note explains the difference.
- Whether the current reporting system keeps the 2017 provisions. The newest full text I reached is dated 2017-09; later notices list the systems without publishing the port tables, so those definitions may have changed.
- Whether the 2025 totals will be revised. The January table and the June bulletin agree and I found no revision notice; I did not check whether 2026 monthly tables restate 2025.
- Why the container gap widened in 2023, from about 10.0 percent in 2021–2022 to 11.3, then back to 10.8. Neither series carries a note for that year.