Data and the world Open dataSources and method
Provincial GDP summed against the national figure
Add up China's 31 provincial GDP figures and the total does not match the national one. The gap is computable, and the statistics office explains it.
Living page — numbers read from the sources on 2026-10-11, re-checked yearly.
China publishes GDP twice over. The National Bureau of Statistics (NBS) puts out one national number, and each of 31 provincial-level units publishes its own regional figure. Add the 31 up and you get a different total.
For 2024 my sum of the provincial figures is 134.03 trillion yuan. The national preliminary figure for that year was 134.91 trillion (NBS, 2025-01-17). The gap is −0.65%. Eight years earlier the same exercise ran the other way: the provincial figures for 2016 added to 78.01 trillion against a national 74.41 trillion, +4.83%.
The sign flips at 2019, the first year accounted under the unified regional accounting system. Everything here comes from NBS publications: the yearbook’s regional tables, the annual GDP communiqués, the verification announcements, and three NBS explainers.
Every number below is one fixed vintage, read on 2026-10-11 (China Standard Time), and all of them move.
The year-by-year table
Amounts in trillion yuan, current prices. “Sum” is my addition of the 31 provincial values printed in the yearbook edition that carries that year.
| Year | Sum of 31 provinces | National, preliminary | National, latest revision | Sum − preliminary | Sum − latest revision |
|---|---|---|---|---|---|
| 2015 | 72.28 | 67.67 | 68.91 | +4.61 (+6.81%) | +3.37 (+4.89%) |
| 2016 | 78.01 | 74.41 | 74.36 | +3.60 (+4.83%) | +3.65 (+4.90%) |
| 2017 | 84.71 | 82.71 | 82.08 | +2.00 (+2.42%) | +2.63 (+3.21%) |
| 2018 | 91.47 | 90.03 | 91.93 | +1.44 (+1.60%) | −0.46 (−0.50%) |
| 2019 | 98.53 | 99.09 | 98.65 | −0.56 (−0.56%) | −0.12 (−0.12%) |
| 2020 | 101.24 | 101.60 | 101.36 | −0.36 (−0.35%) | −0.12 (−0.12%) |
| 2021 | 113.77 | 114.37 | 114.92 | −0.60 (−0.52%) | −1.15 (−1.00%) |
| 2022 | 120.35 | 121.02 | 120.47 | −0.67 (−0.56%) | −0.12 (−0.10%) |
| 2023 | 125.09 | 126.06 | 129.43 | −0.97 (−0.77%) | −4.34 (−3.35%) |
| 2024 | 134.03 | 134.91 | 134.81 | −0.88 (−0.65%) | −0.78 (−0.58%) |
The provincial sums come from the yearbook’s regional GDP table, one edition per year. All retrieved 2026-10-11.
| Year | Yearbook edition | Regional table |
|---|---|---|
| 2024 | 2025 | table 3-9 |
| 2023 | 2024 | table 3-9 |
| 2022 | 2023 | table 3-9 |
| 2021 | 2022 | table 3-9 |
| 2020 | 2021 | table 3-9 |
| 2019 | 2020 | table 3-9 |
| 2018 | 2019 | table 3-9 |
| 2017 | 2018 | table 3-9 |
| 2016 | 2017 | table 3-9 |
| 2015 | 2016 | table 3-11 |
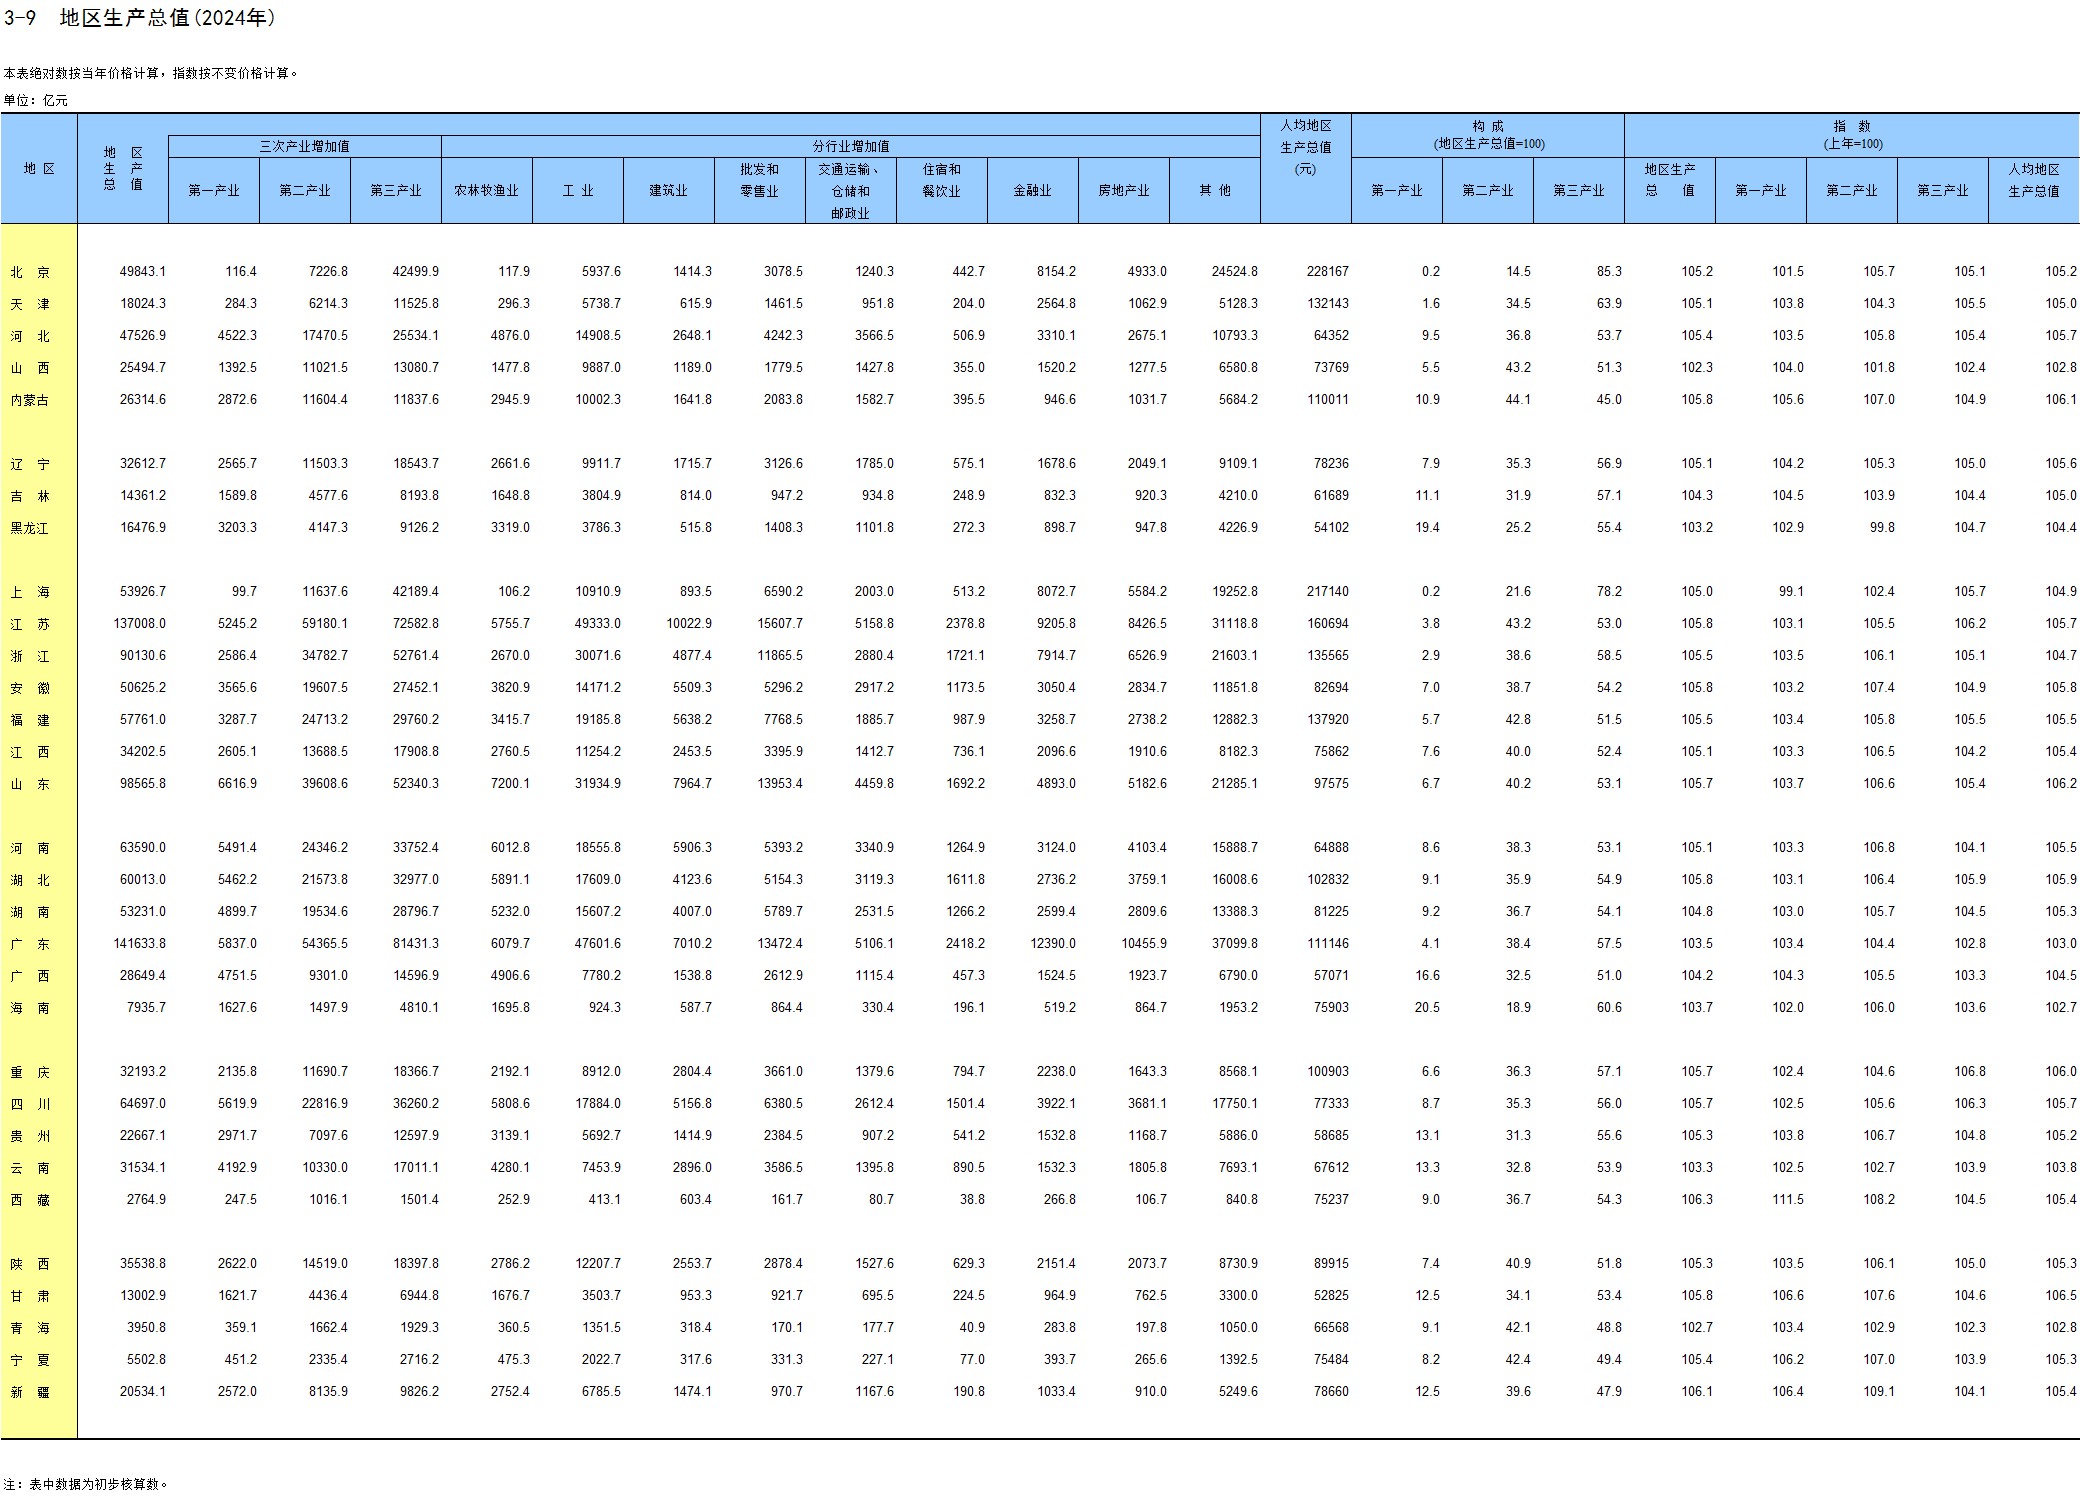
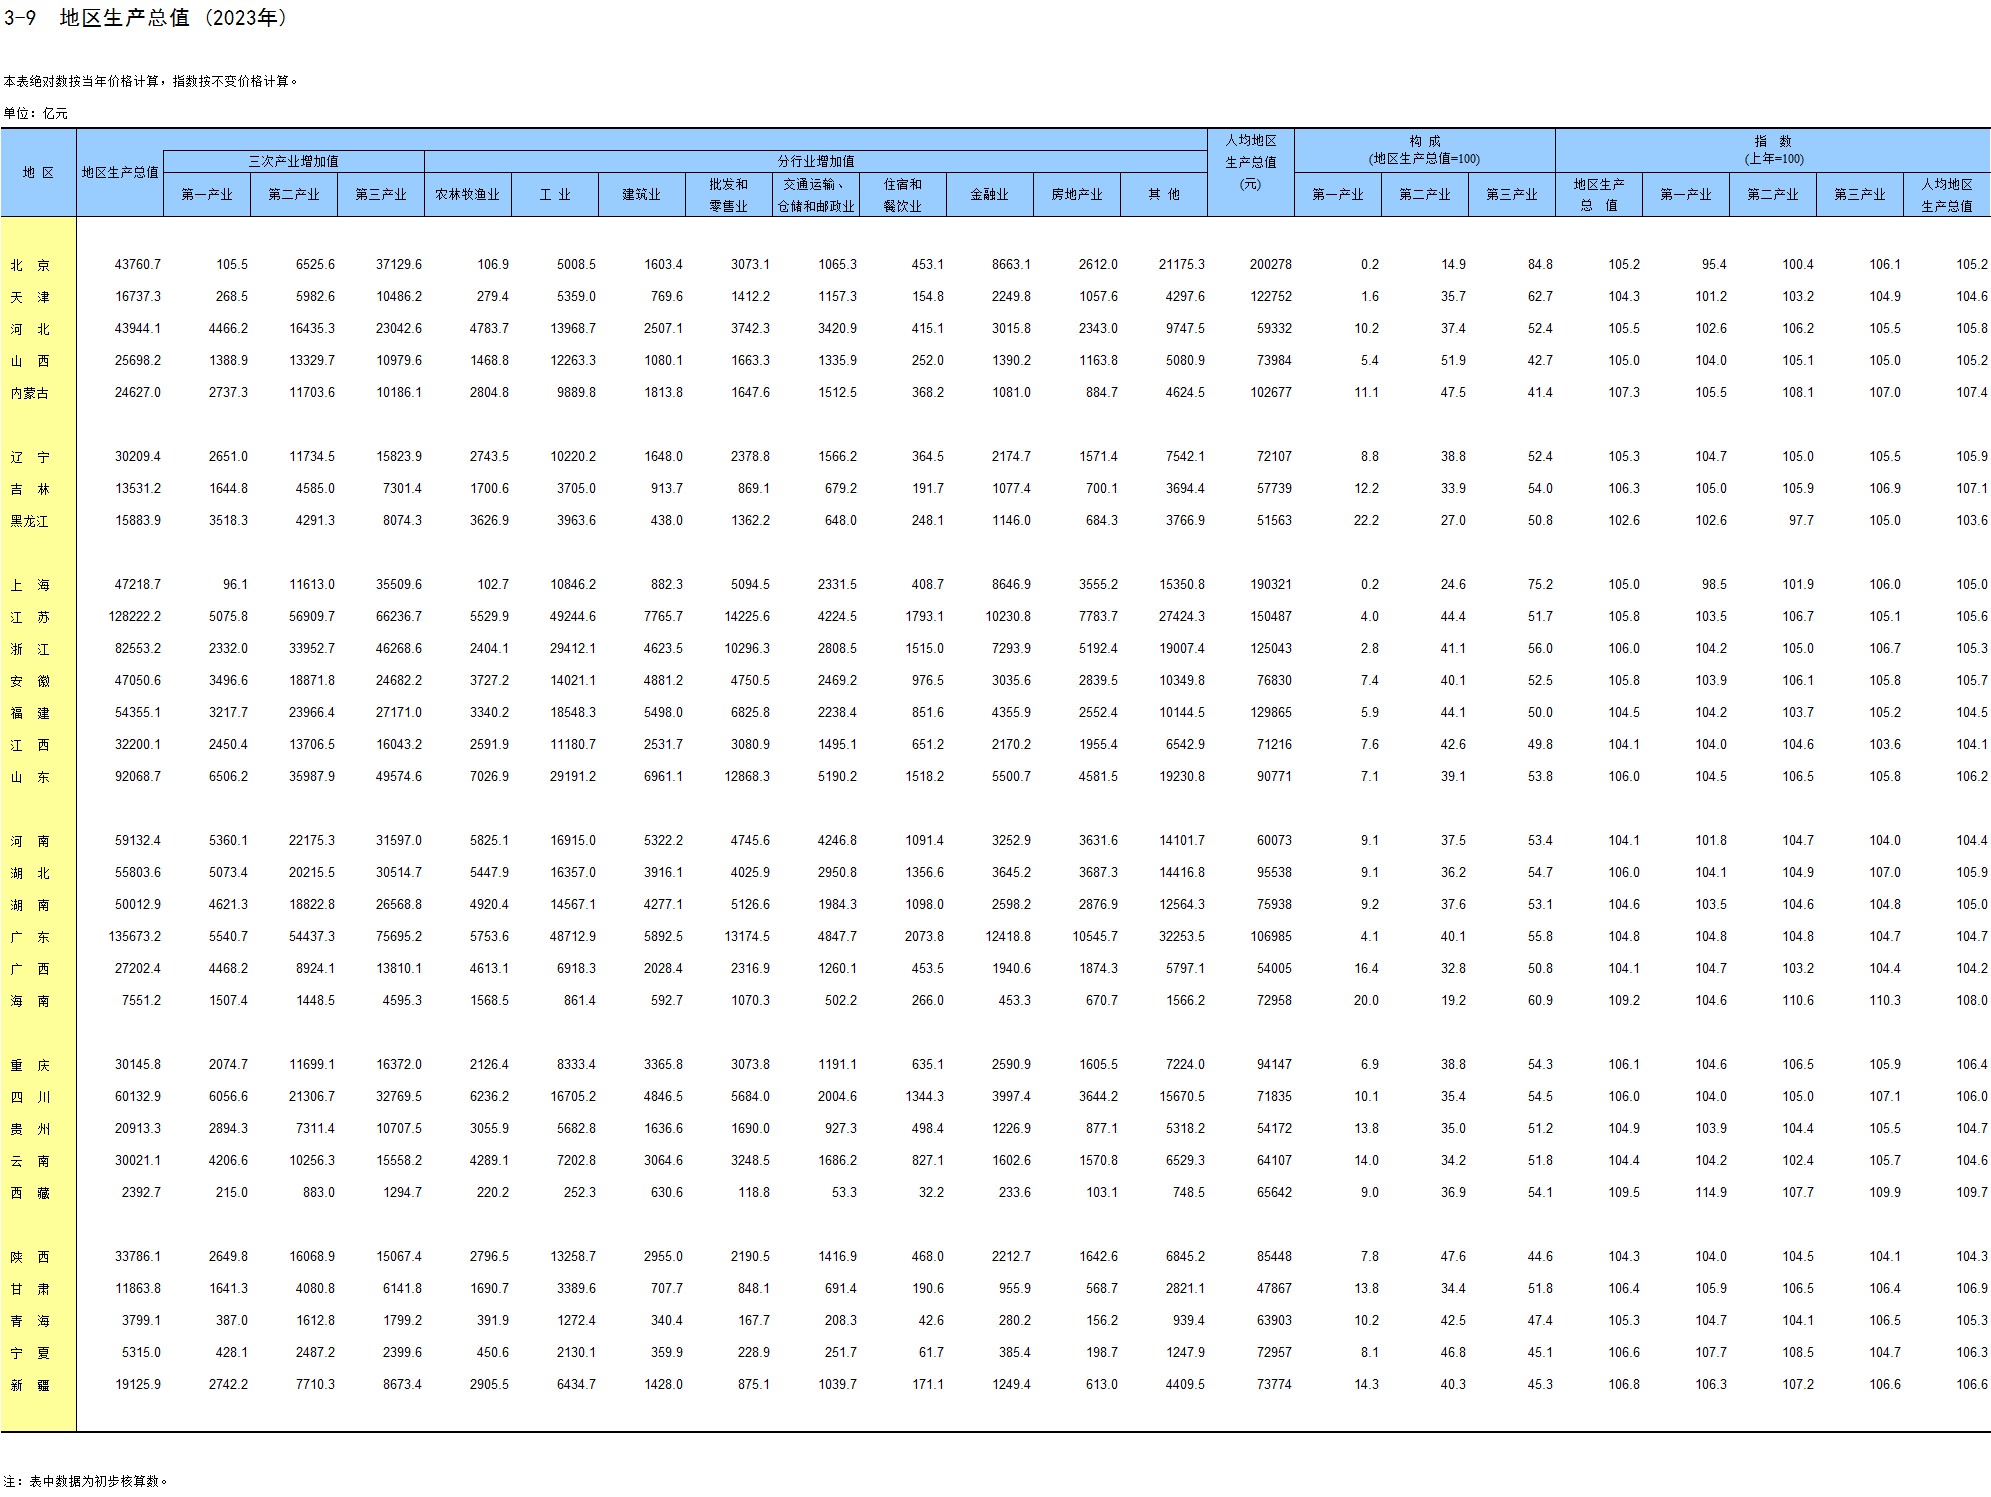
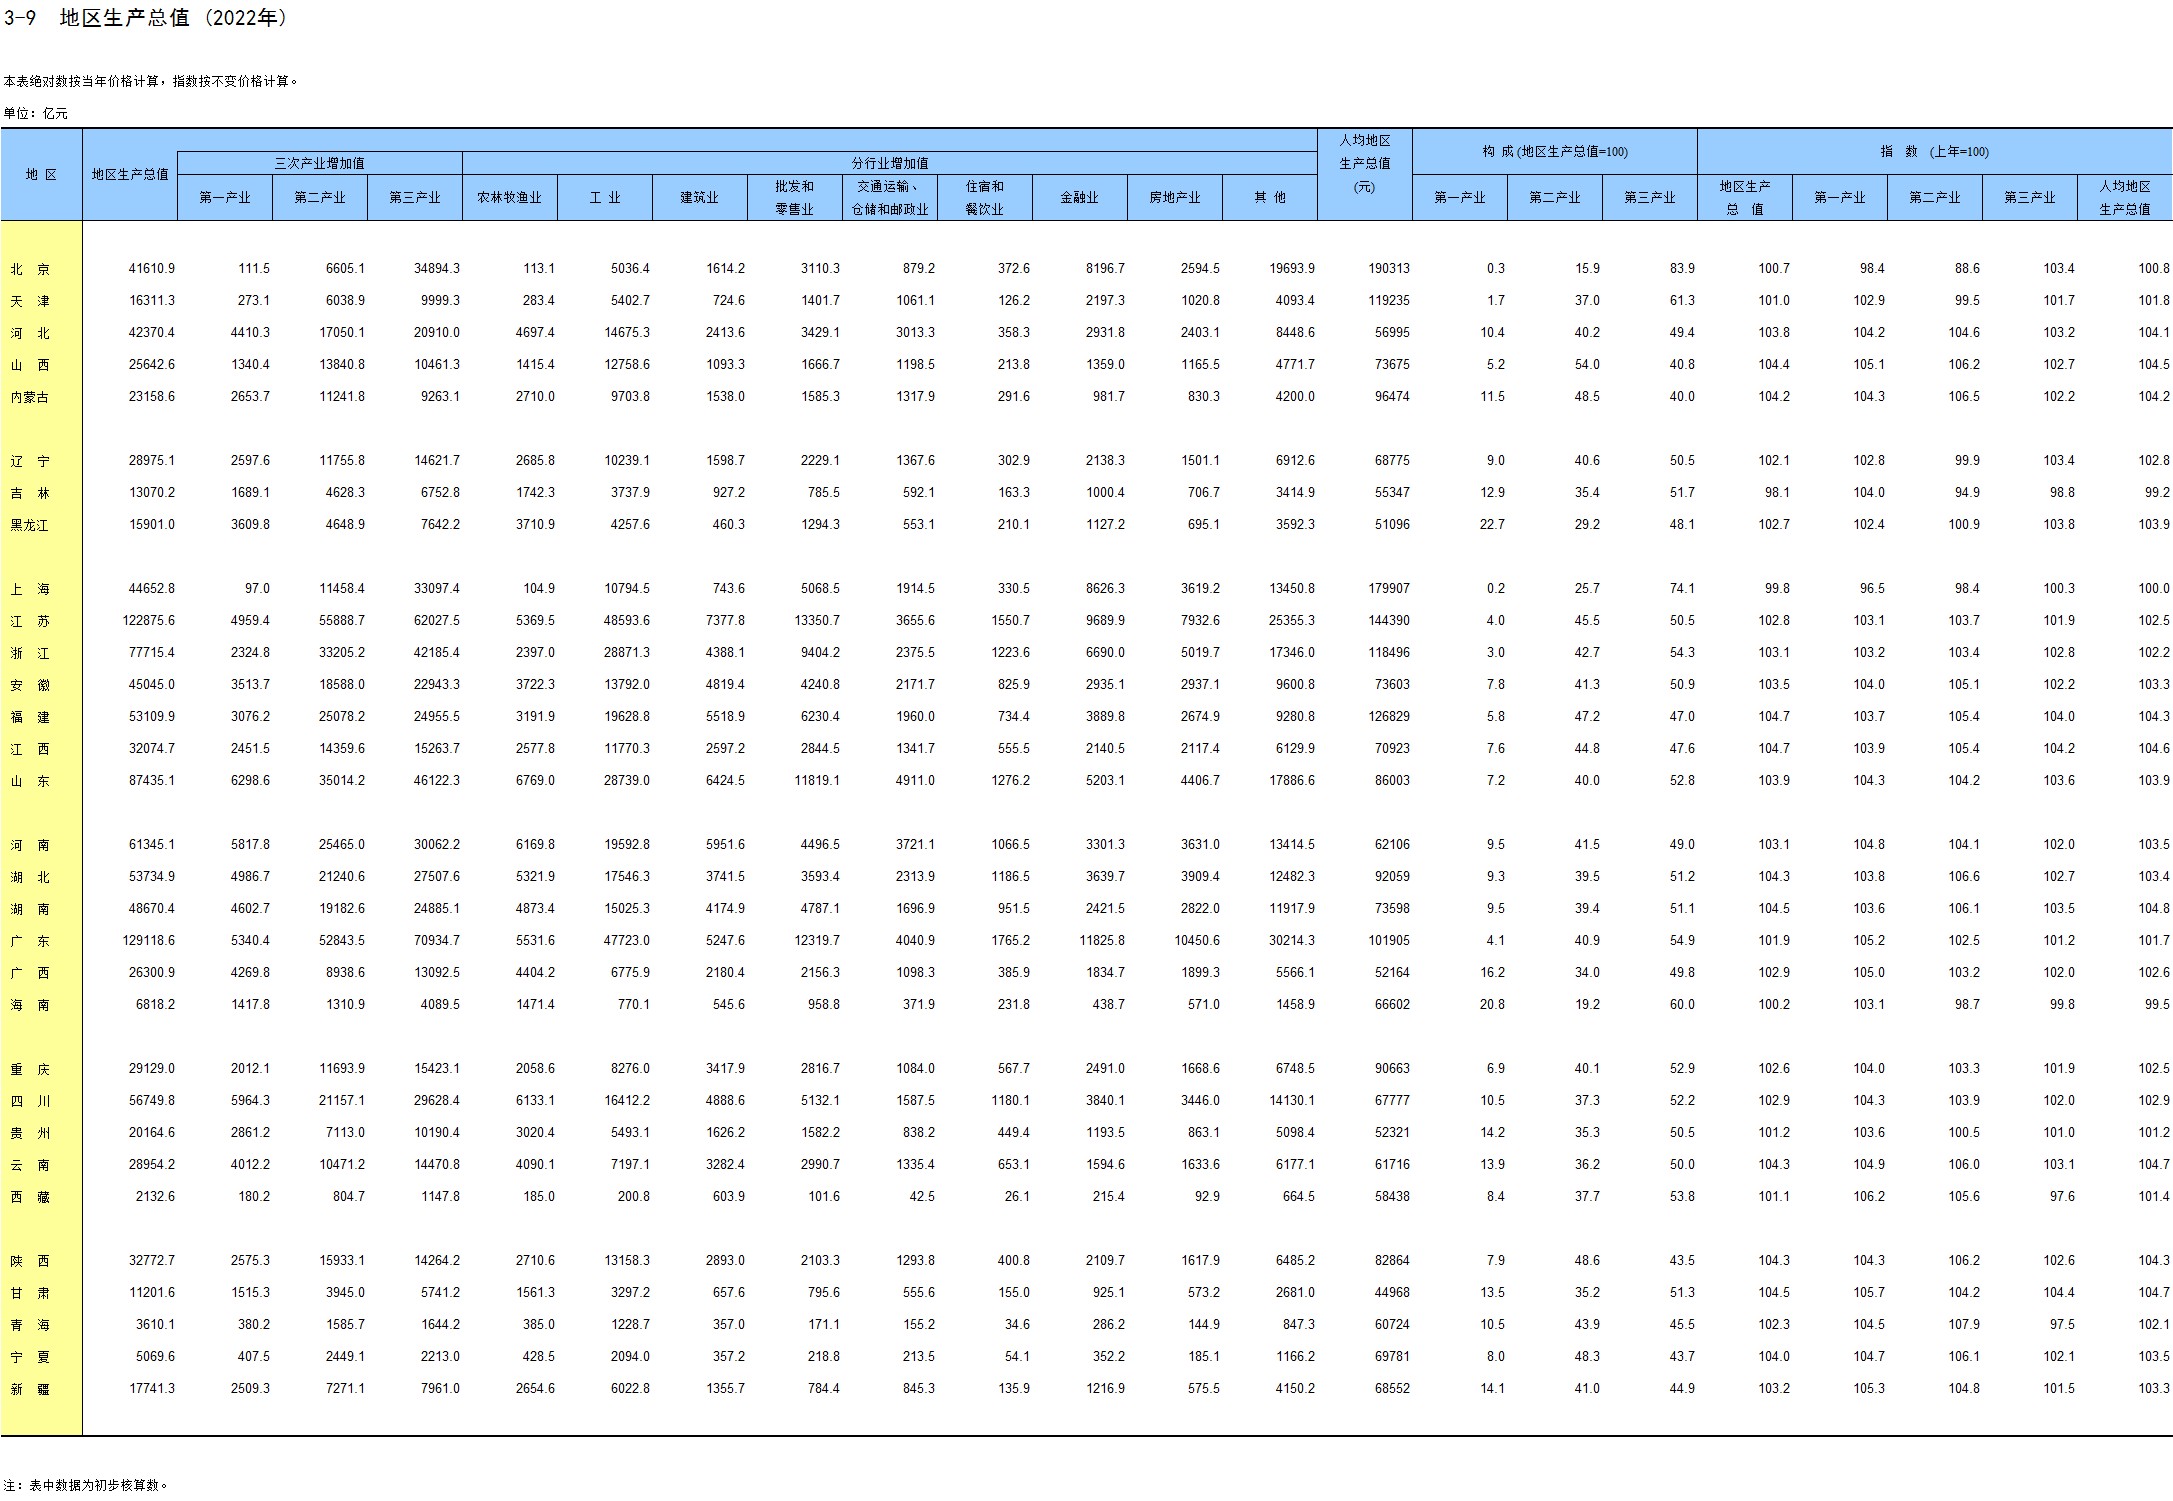

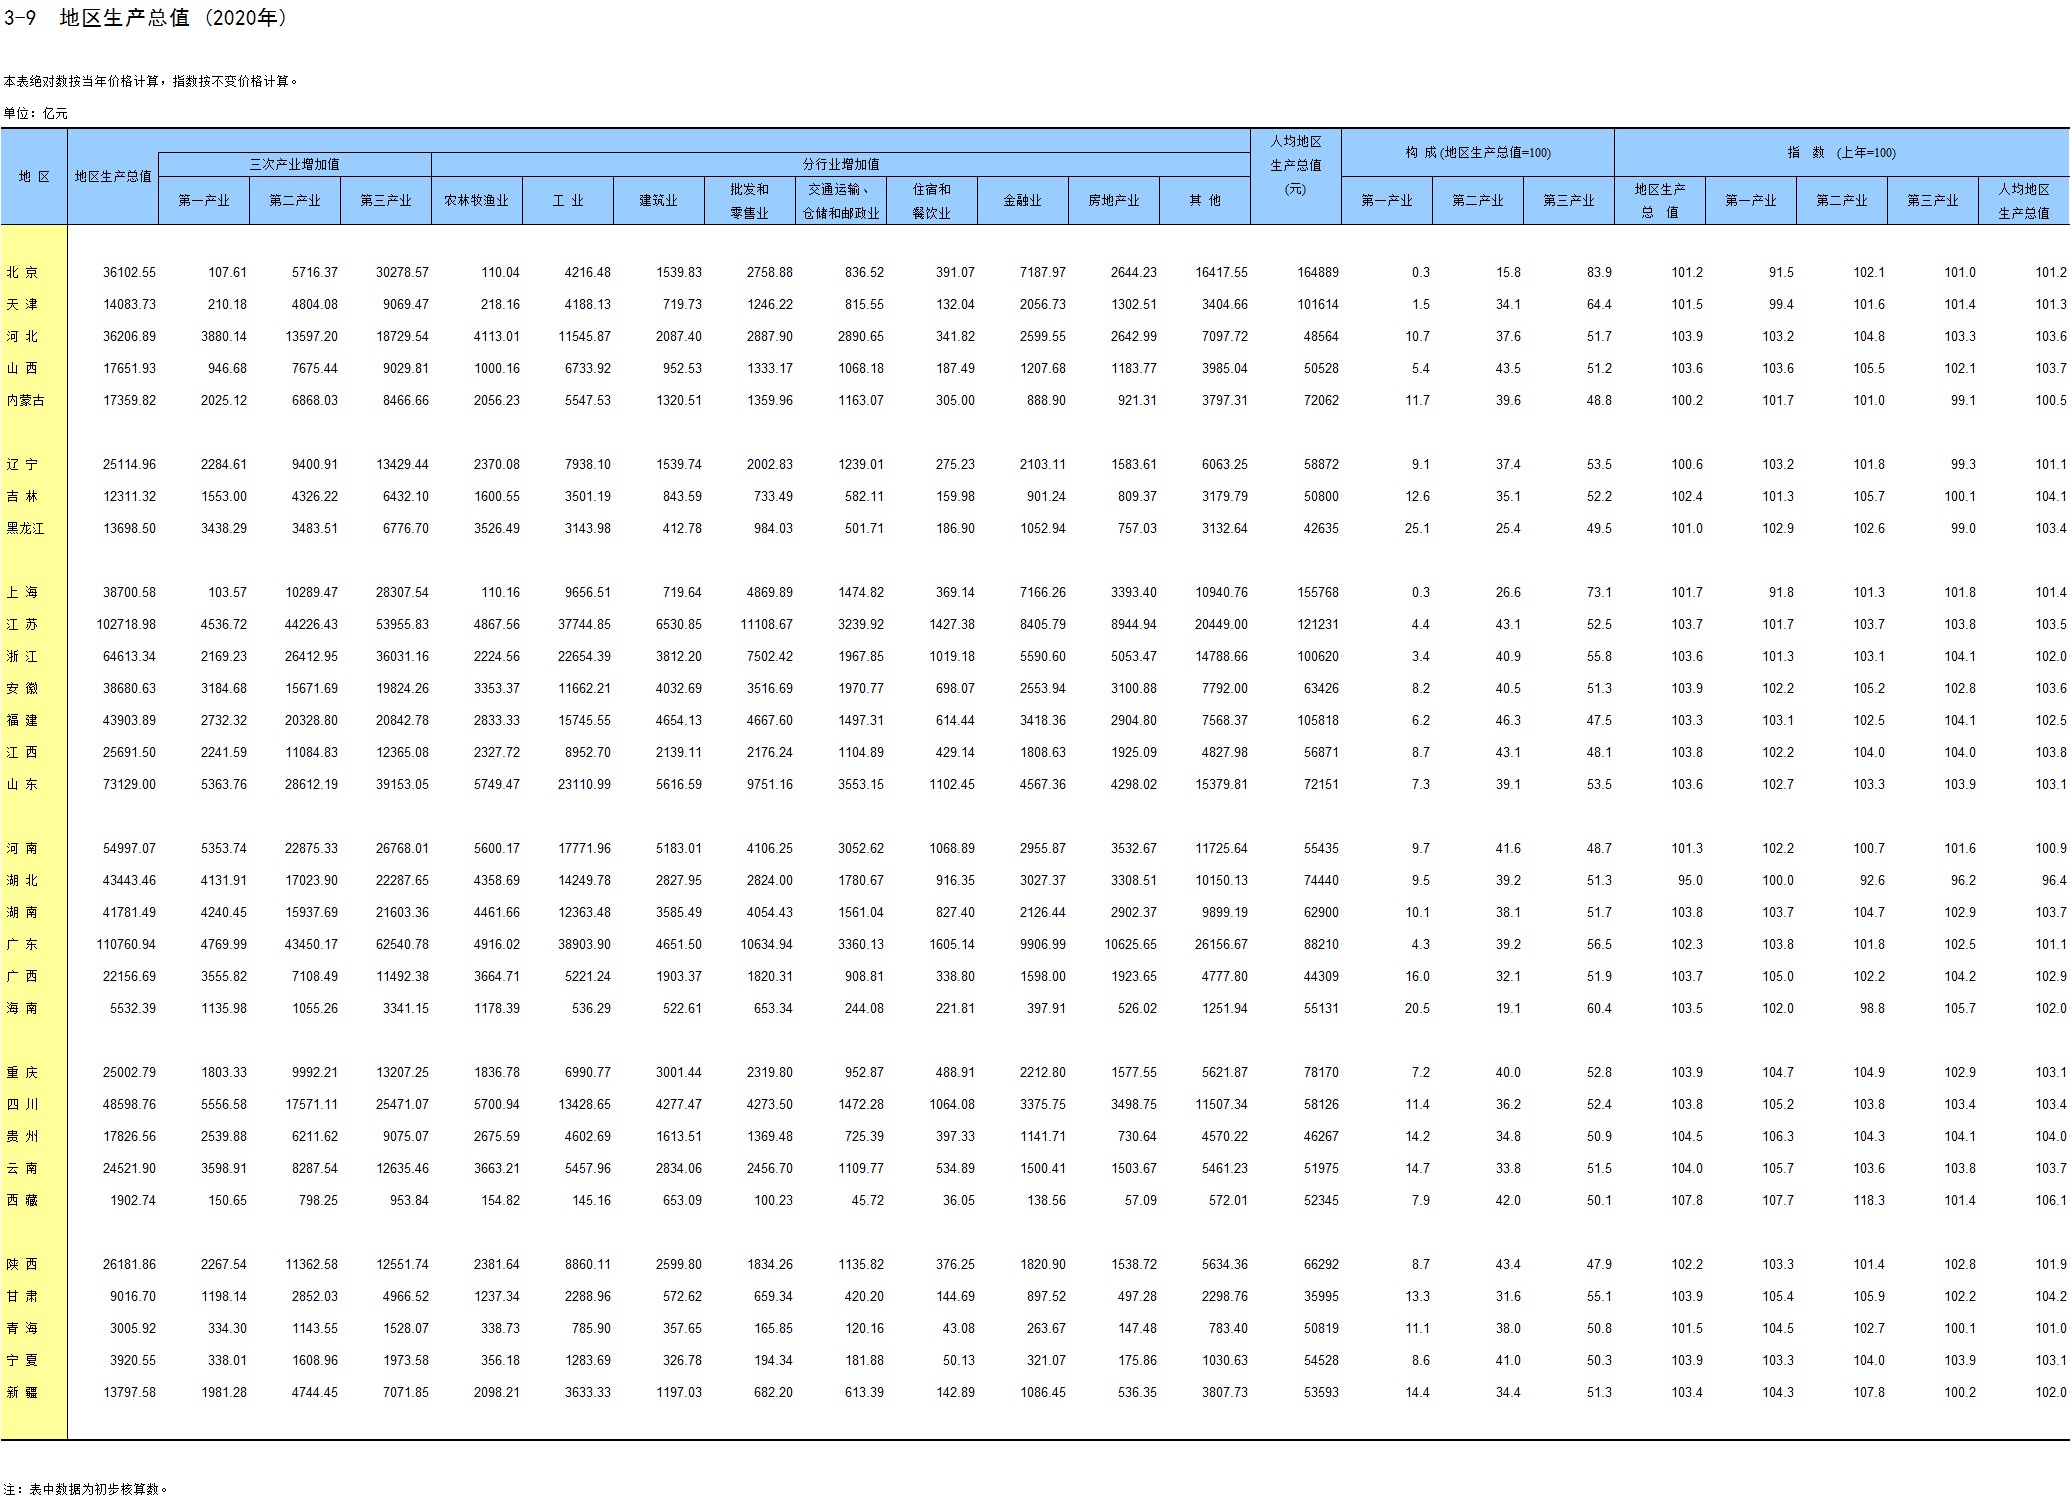

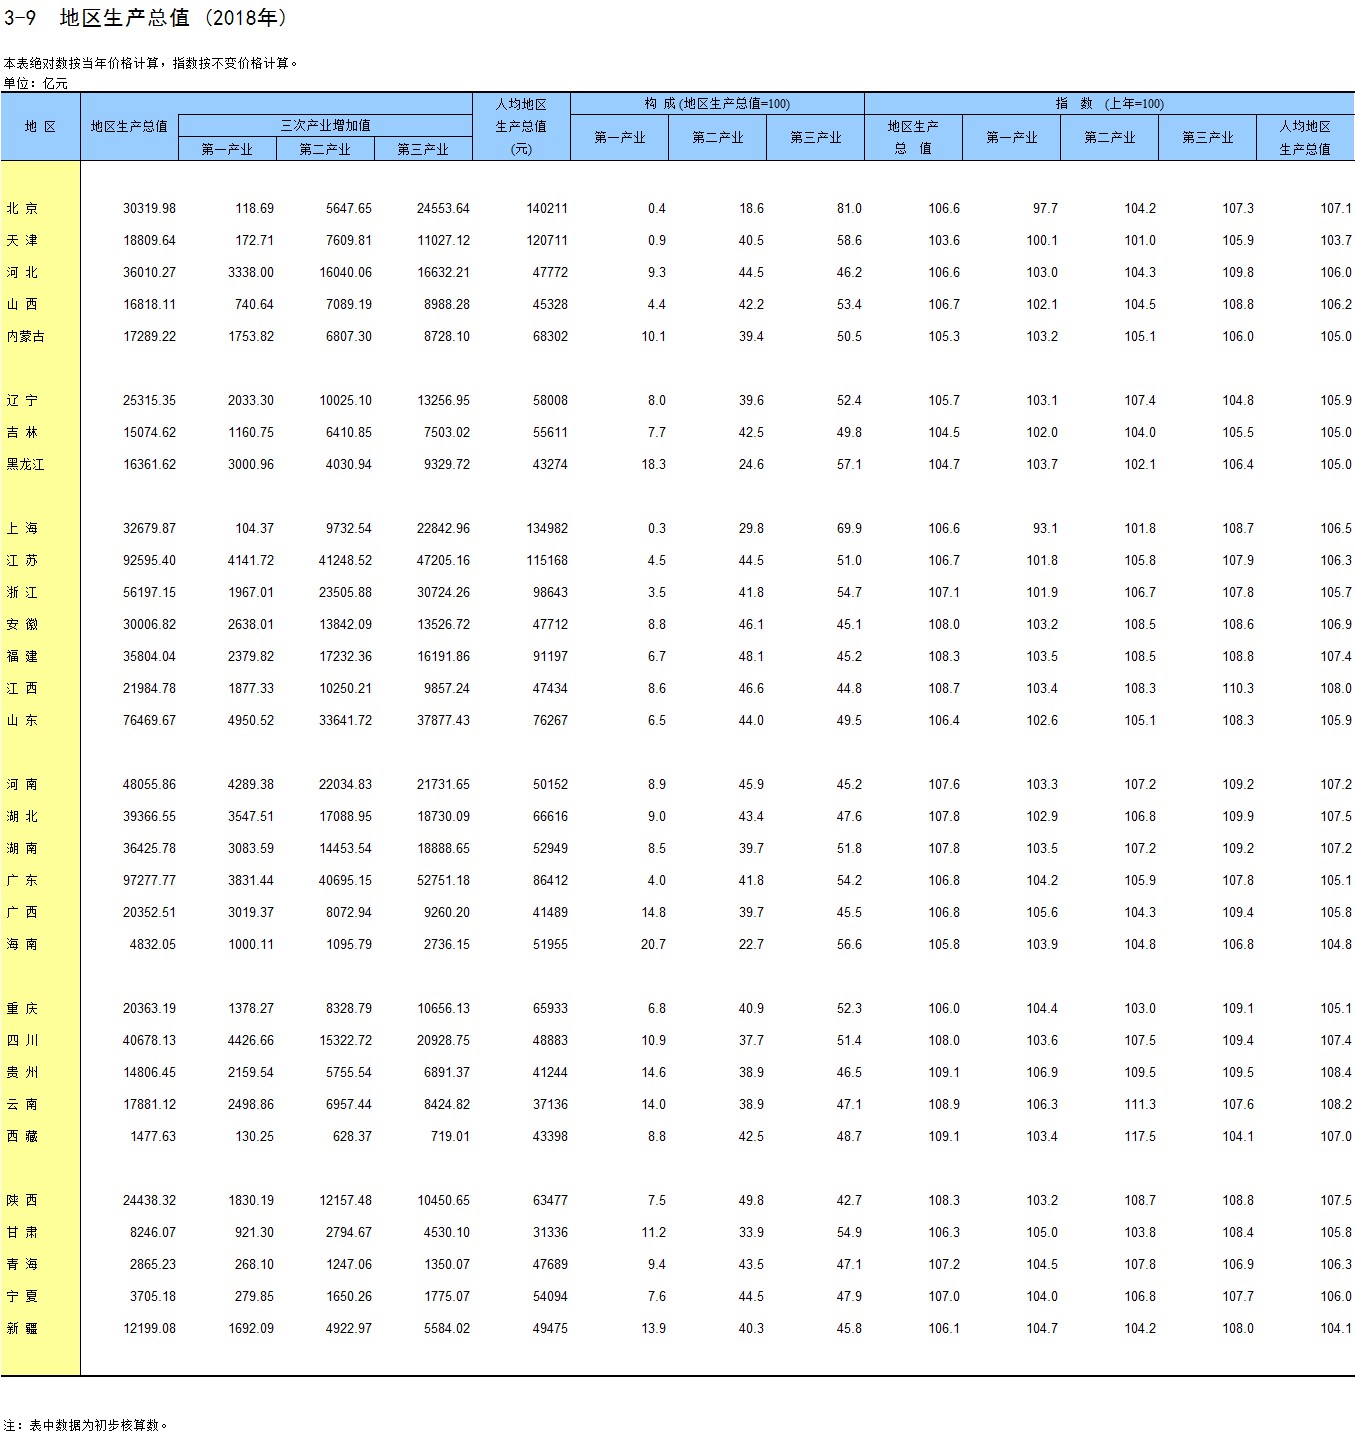
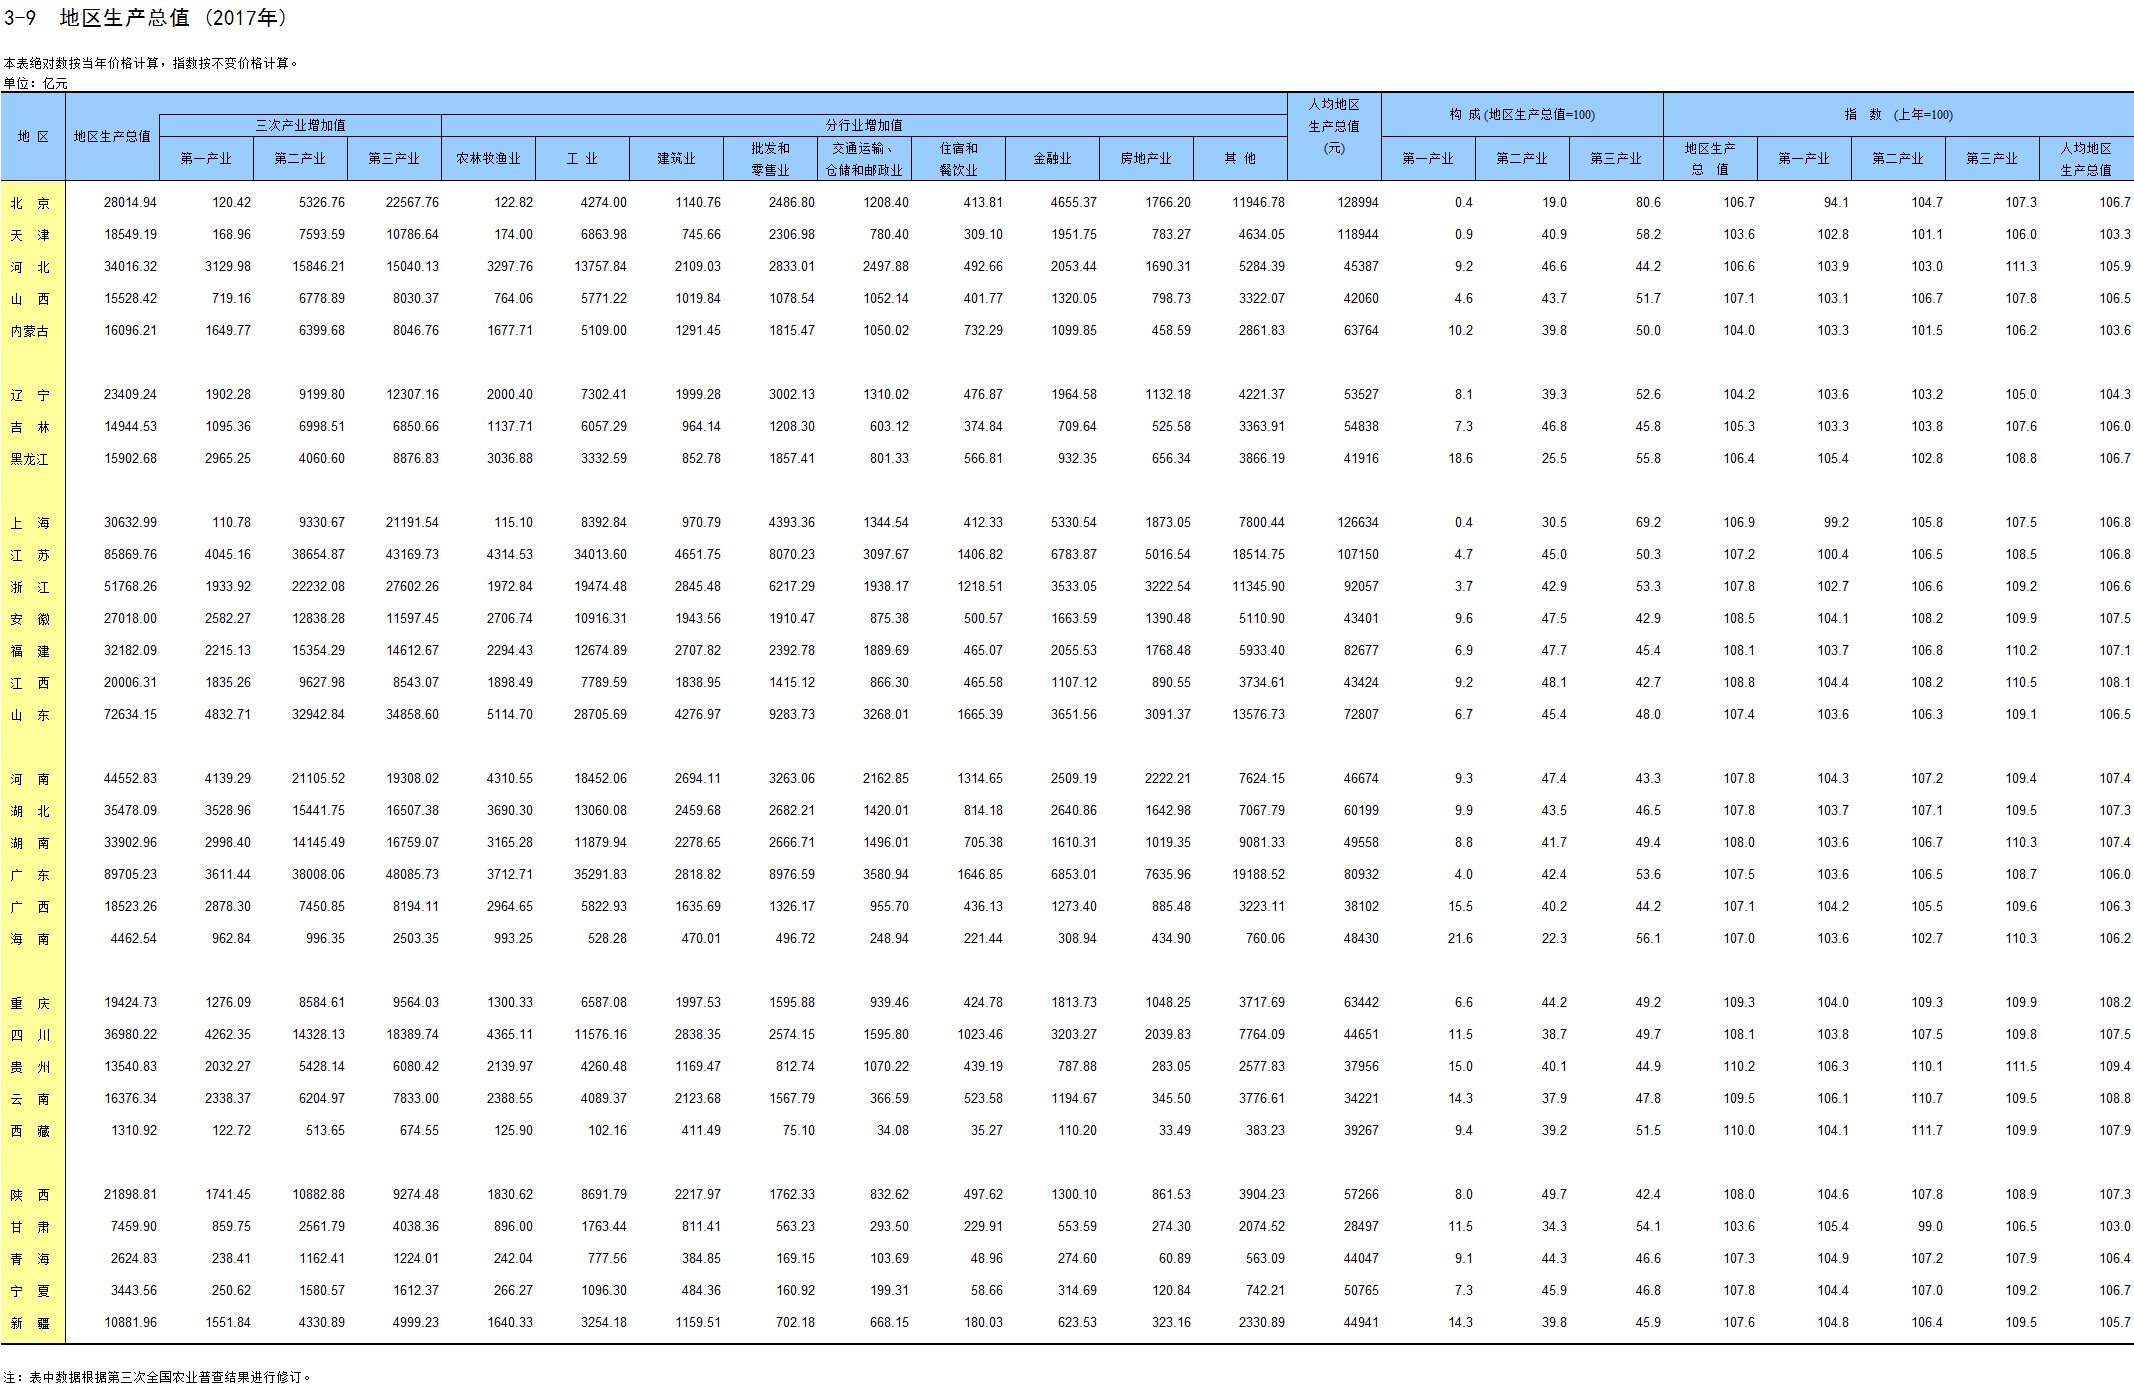
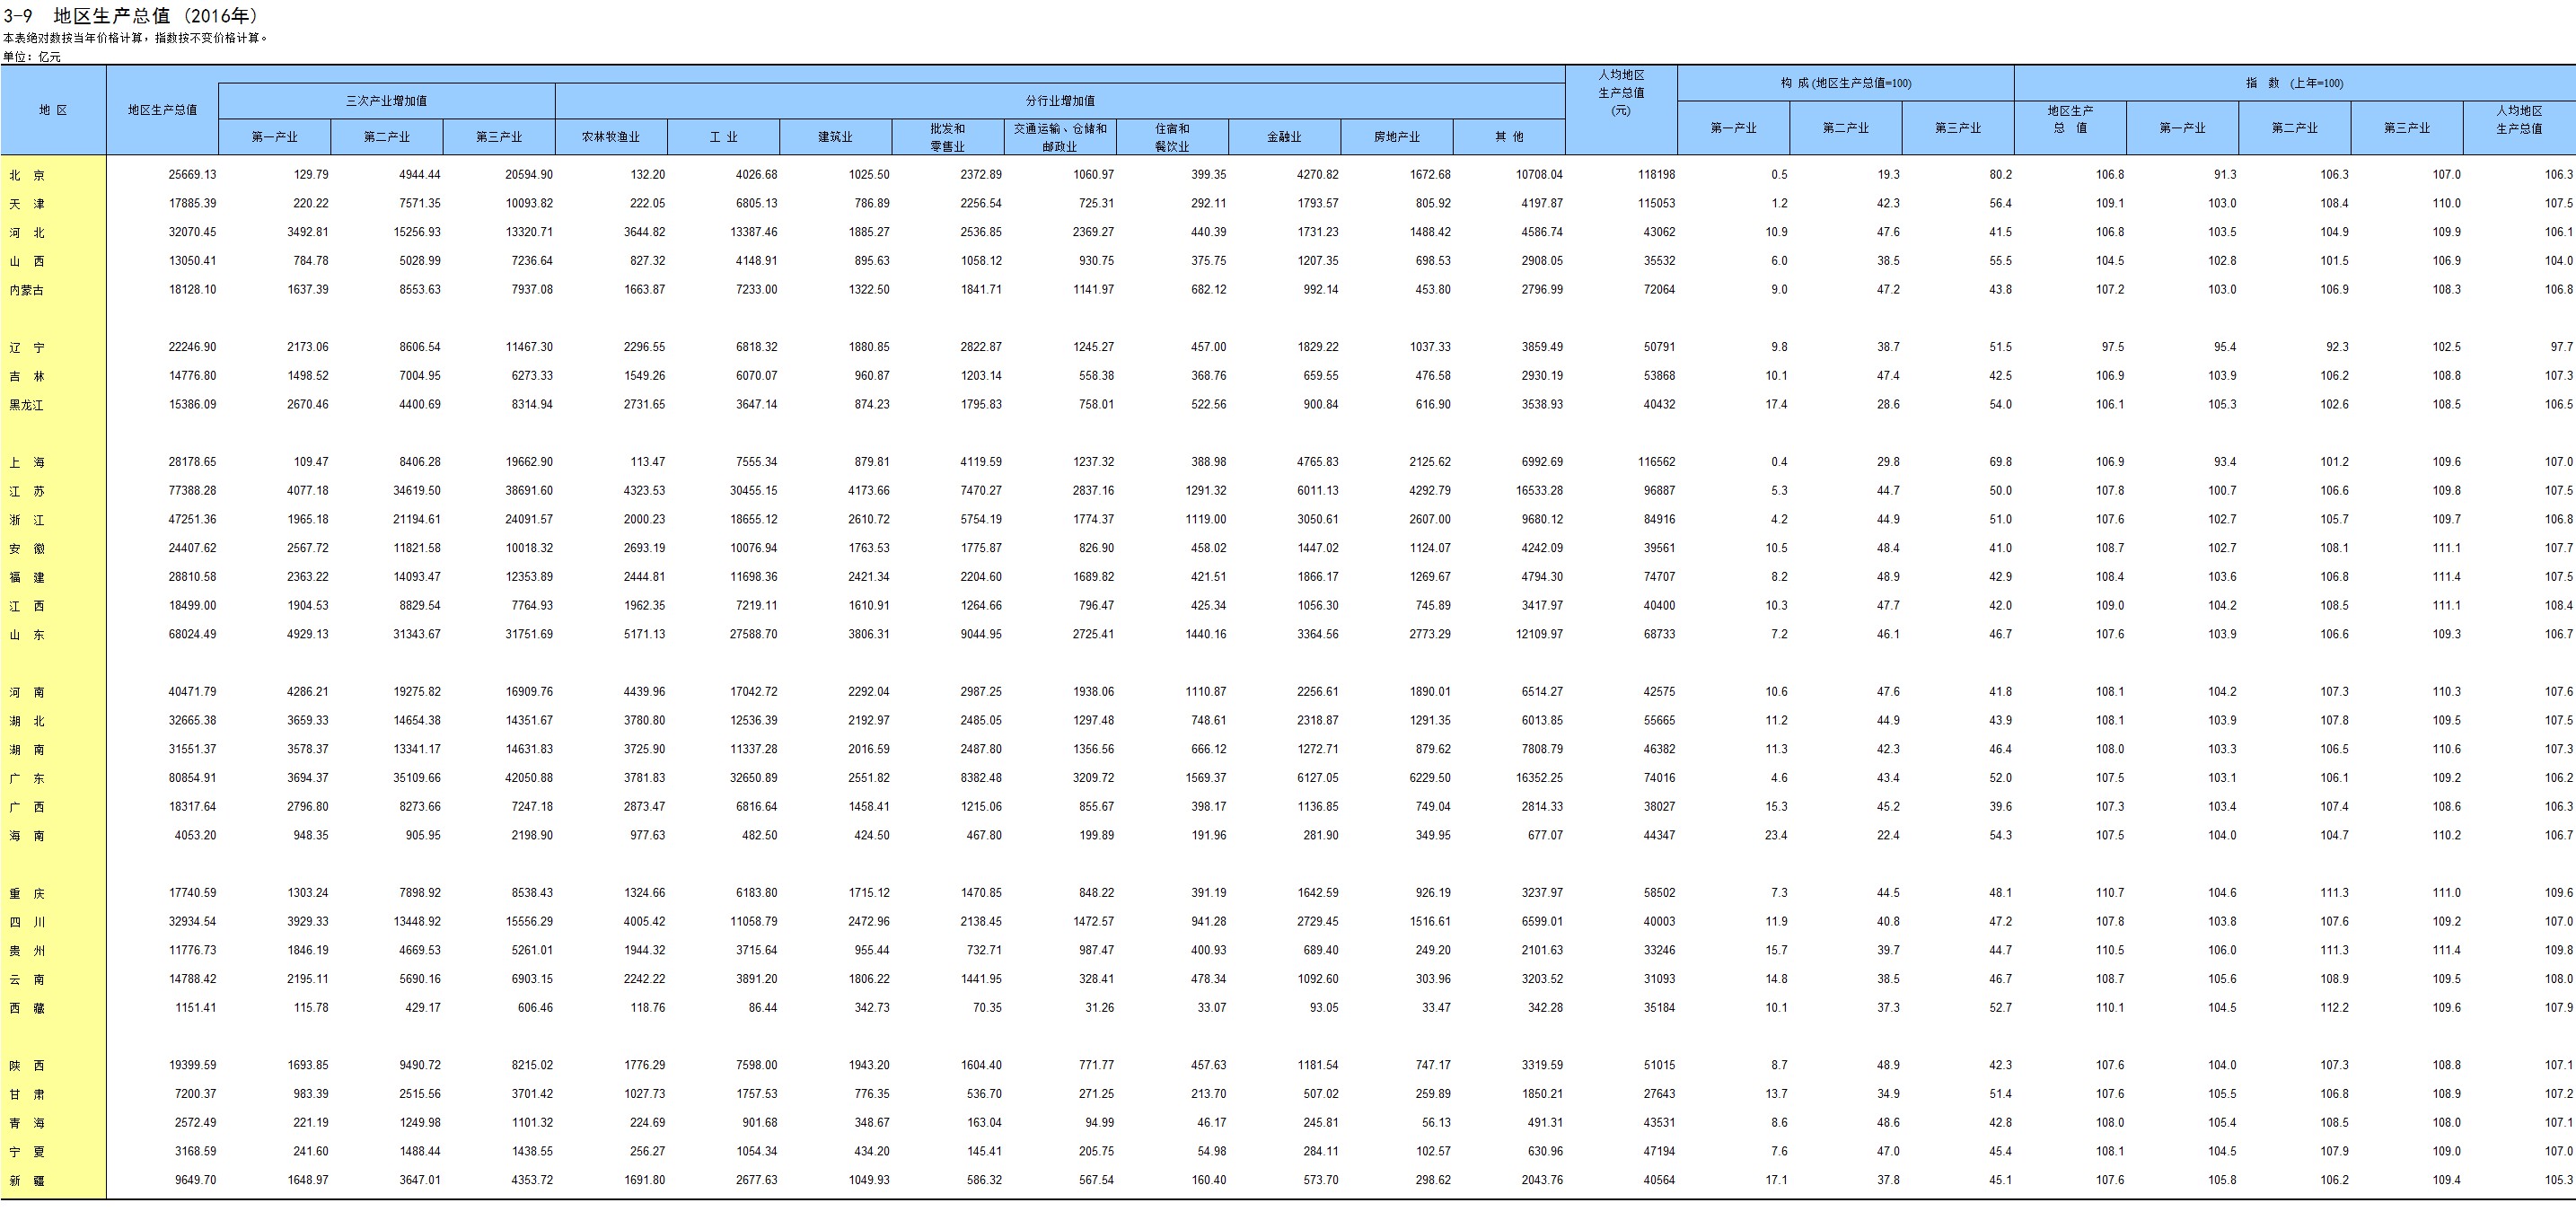
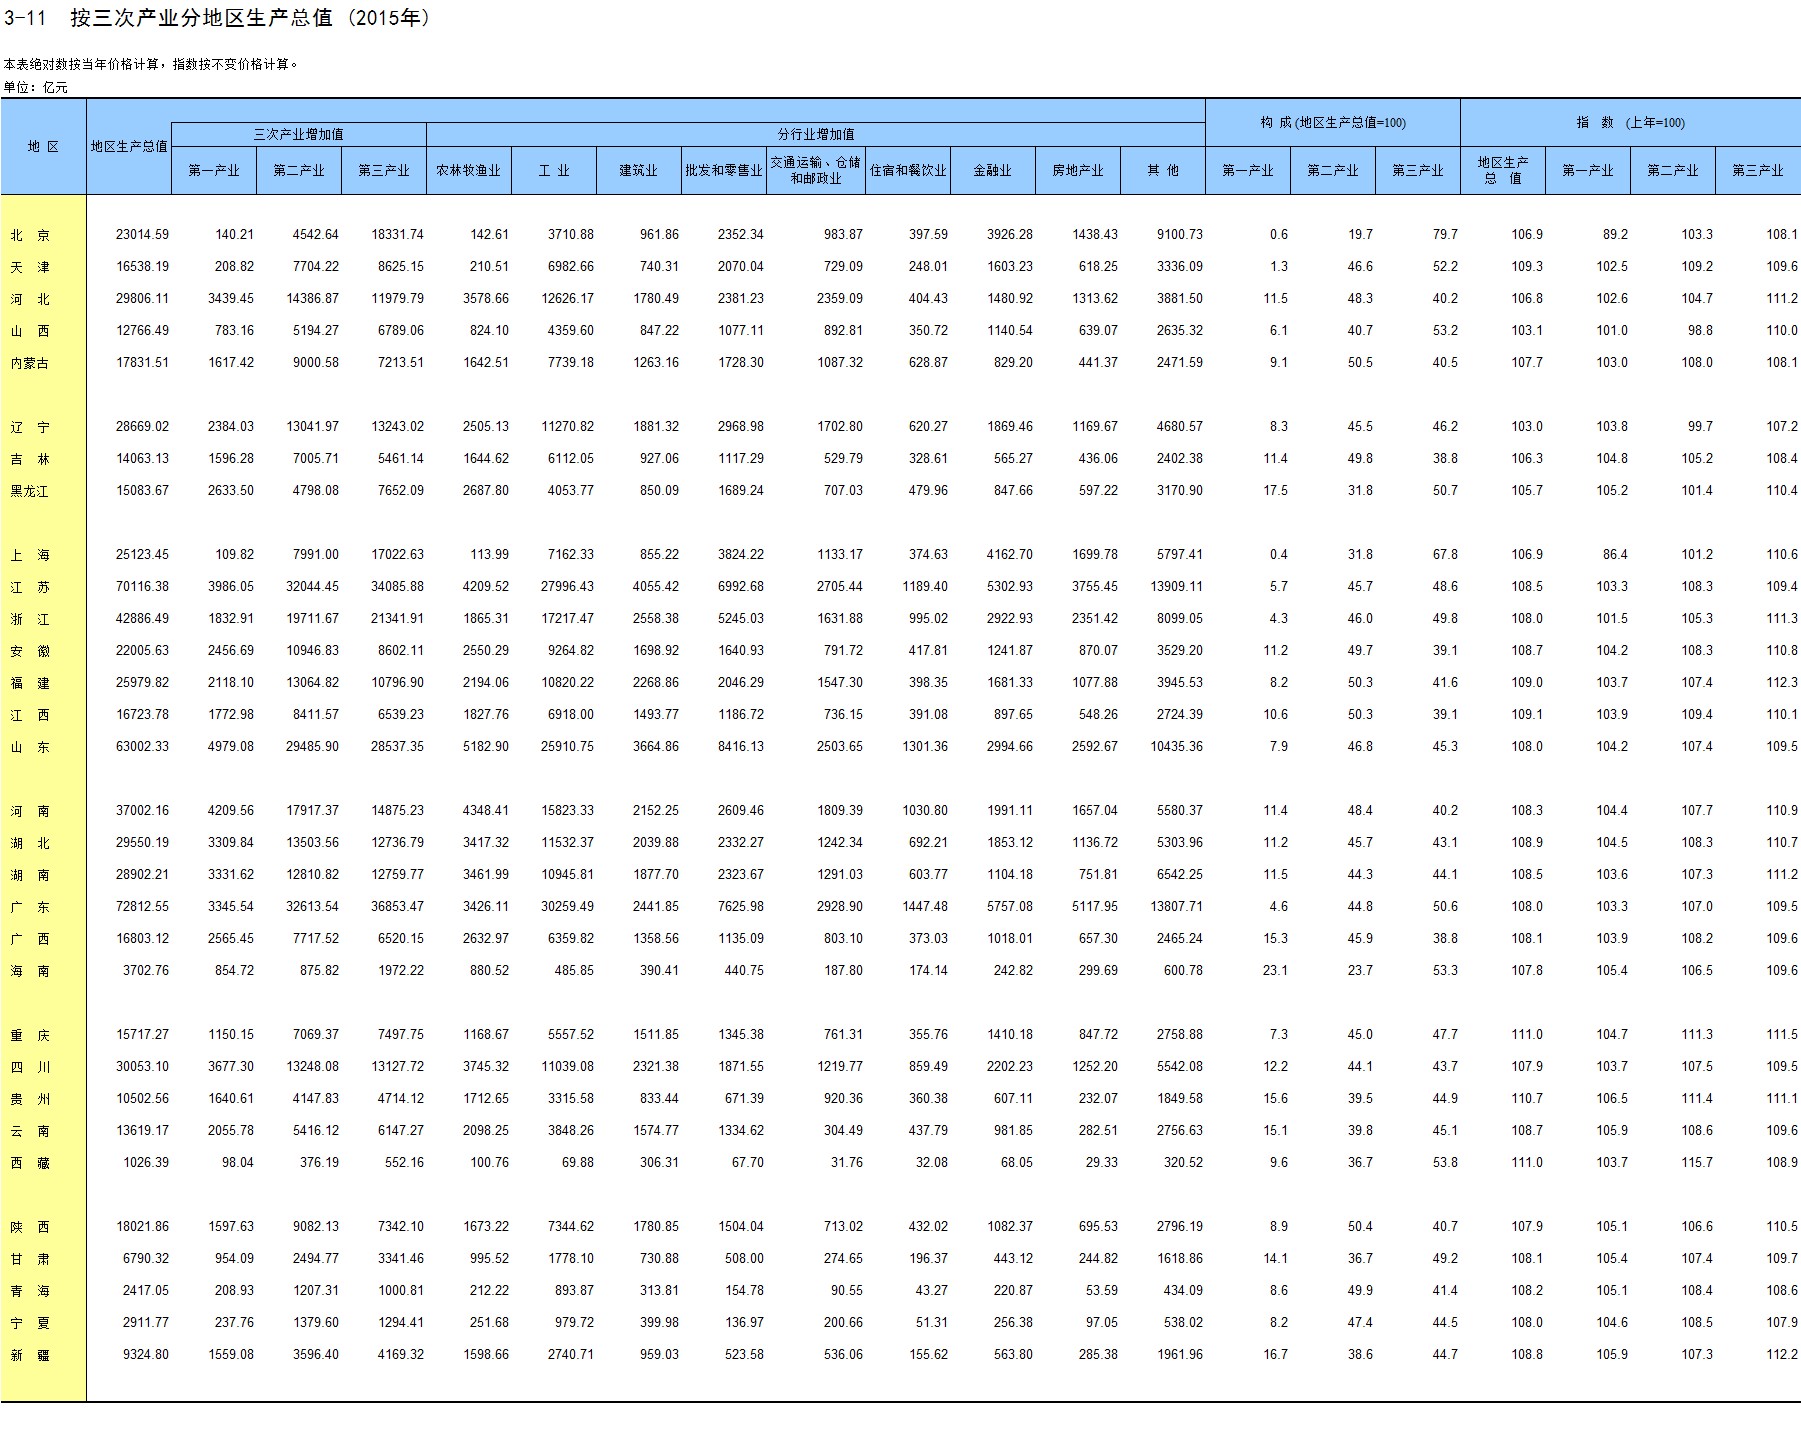
Each table prints its own title line with the data year, which is how the edition-to-year match was checked: the 2025 edition, for instance, is headed “3-9 地区生产总值 (2024年)”. The 2015 table carries a different number and a different column layout, the only break in the series.
The national figures, with the date each was published:
| Year | Preliminary | Published | Latest revision | Published |
|---|---|---|---|---|
| 2015 | 67.67 | 2016-02-29 | 68.91 | 2017-01-09 |
| 2016 | 74.41 | 2017-02-28 | 74.36 | 2018-01-05 |
| 2017 | 82.71 | 2018-02-28 | 82.08 | 2019-01-18 |
| 2018 | 90.03 | 2019-02-28 | 91.93 | 2019-11-22 |
| 2019 | 99.09 | 2020-02-28 | 98.65 | 2020-12-30 |
| 2020 | 101.60 | 2021-02-28 | 101.36 | 2021-12-17 |
| 2021 | 114.37 | 2022-02-28 | 114.92 | 2022-12-27 |
| 2022 | 121.02 | 2023-02-28 | 120.47 | 2023-12-29 |
| 2023 | 126.06 | 2024-02-29 | 129.43 | 2024-12-27 |
| 2024 | 134.91 | 2025-01-17 | 134.81 | 2025-12-26 |
Each preliminary figure is the one printed in that year’s annual communiqué, dated as shown; for 2024 I used the January release. The 2020 and 2021 verification announcements also print both numbers side by side. The 2018 and 2023 revisions are economic-census revisions rather than the routine final verification.
Three things the table shows.
From 2015 to 2018 the provincial sum sat above the national figure every year, by 6.81%, 4.83%, 2.42% and 1.60%. The gap shrank year by year.
From 2019 the sum sits below the national figure, and the gap is small: −0.35% to −0.77% across the six years. Against the later revisions the same rows run from −0.10% to −1.00%, with one outlier at −3.35%. That outlier is 2023, and the explanation is mechanical: the fifth economic census, announced on 2024-12-27, revised the national figure upward only. The provincial sums for 2023 come from the edition published before it.
For 2025 there is no provincial table yet: the yearbook index lists 2025 as the newest edition (NBS yearbook index, retrieved 2026-10-11), so no 2025 sum can be computed. The national preliminary figure is 140.19 trillion yuan (2025 communiqué, NBS, 2026-02-28).
Why the totals differ, in the bureau’s own words
Before 2019, each level accounted for itself. The NBS calls the old system graded accounting: the national bureau computed national GDP, and each provincial bureau computed its own regional figure. The yearbook chapter note of that era says the regional data came from provincial bureaux and that, in the original, “由于采取分级核算,各地区数据相加不等于全国总计” — because the accounting was graded, the regional figures did not add to the national total (China Statistical Yearbook 2019, chapter 3 note, retrieved 2026-10-11). An NBS explainer gives the reasons it attributes to that gap: incomplete basic data, non-standard accounting methods, and interference from performance assessment (NBS, 什么是三大核算改革, page dated 2024-12-17). The bureau’s own interview on the reform states the outcome: the regional sum “长期高于国内生产总值”, long sat above national GDP (NBS interview, 2019-12-27).
After 2019, one body does the accounting, and the expected sign is negative. Regional GDP is now led, organised and implemented by the NBS with provincial bureaux participating, and provinces no longer submit their own GDP totals (NBS, 地区生产总值统一核算如何实施, page dated 2024-12-18). The current yearbook note states the consequence: “由于部分活动仅核算在全国、不核算在地区,各地区数据相加之和略小于全国” — because some activity is accounted only nationally and not by region, the regional sum comes out slightly smaller than the national total (China Statistical Yearbook 2025, chapter 3 note, retrieved 2026-10-11).
The bureau names what is not split by region. The same explainer lists what stays in the national accounts only: embassies and consulates abroad, confidential units that cannot sensibly be divided by region, headquarters-economy activity, and the armed forces and armed police (NBS, 地区生产总值核算方法, 2024-12-30).
Where regional data are thin, the national number is split, and any residual is spread. Two mechanisms sit in the same explainer. Industries with no regional source data are not accounted regionally; the national figure is divided among provinces using related indicators. Where the summed regional value added still differs from the national figure, the difference is allocated across provinces in proportion to their share of that industry, so the two line up. In the original: “利用地区行业增加值占比分摊差额,实现地区汇总数与国家数基本衔接”.
The national number is provisional twice. Annual GDP is accounted twice: a preliminary figure completed before 20 January, then a final verification built on the bureau’s annual reports, the Finance Ministry’s final accounts and departmental financial returns. The annex to the 2024 announcement sets the deadline at the January of the year after next, and the 2019, 2020, 2021, 2022 and 2024 verifications all came out in the following December (中国GDP年度核算说明, annex to NBS, 2025-12-26). Each routine verification prints its own change, from −636.7 billion yuan (2017) to +556.7 billion (2021). The 2015 entry, +354.6 billion, is measured against a preliminary already restated by the 2016 research-and-development revision, not against the 67.67 trillion the communiqué first printed. Censuses then rewrite the whole back series.
Who changed the accounting, and when
The dated record, from the bureau’s documents:
| Date | What changed | Source |
|---|---|---|
| 2016 | Research and development spending reclassified as gross fixed capital formation; the 1952–2015 series revised | Yearbook 2017, chapter 3 note |
| 2017-06-26 | The Central Leading Group for Comprehensively Deepening Reform approved the plan for unified regional accounting | NBS explainer |
| 2017-07-30 | The Party and State Council general offices issued the plan, scheduling the reform for the 2019 annual data | NBS explainer |
| 2019-11-11 | NBS mobilisation meeting for the unified accounting reform | NBS interview, 2019-12-27 |
| 2019-11-22 | Fourth national economic census: 2018 national GDP revised up by 189.72 billion yuan (2.1%) to 91.93 trillion | NBS announcement |
| 2020-01 | Unified accounting begins: the bureau puts the first quarterly round in January 2020 for 2019 and the first annual round in November 2020 | NBS explainer |
| 2024-12-27 | Fifth national economic census: 2023 national GDP revised up by 336.90 billion yuan (2.7%) to 129.43 trillion, of which 202.57 billion (1.6%) from the census and 134.33 billion (1.1%) from a change in how owner-occupied housing services are accounted | NBS announcement |
One year, three official numbers
The revision machinery leaves one year carrying several official values at once. 2019 is the clean example: a later census revised it again.
| Year | Preliminary | Final verification | Yearbook 2025 series |
|---|---|---|---|
| 2019 | 99.09 | 98.65 | 100.59 |
| 2023 | 126.06 | 129.43 | 129.43 |
| 2024 | 134.91 | 134.81 | 134.91 |
The third column is the national series in China Statistical Yearbook 2025, table 3-1, retrieved 2026-10-11; its chapter note records that the fifth economic census triggered a revision of the historical series. Its GDP column reads 100.5872, 129.4272 and 134.9084 trillion yuan for those three years. For 2023 the yearbook agrees with the census revision. For 2019 it sits 2.0% above the final verification. For 2024 it still shows the preliminary figure, because the yearbook’s last year is not final yet.
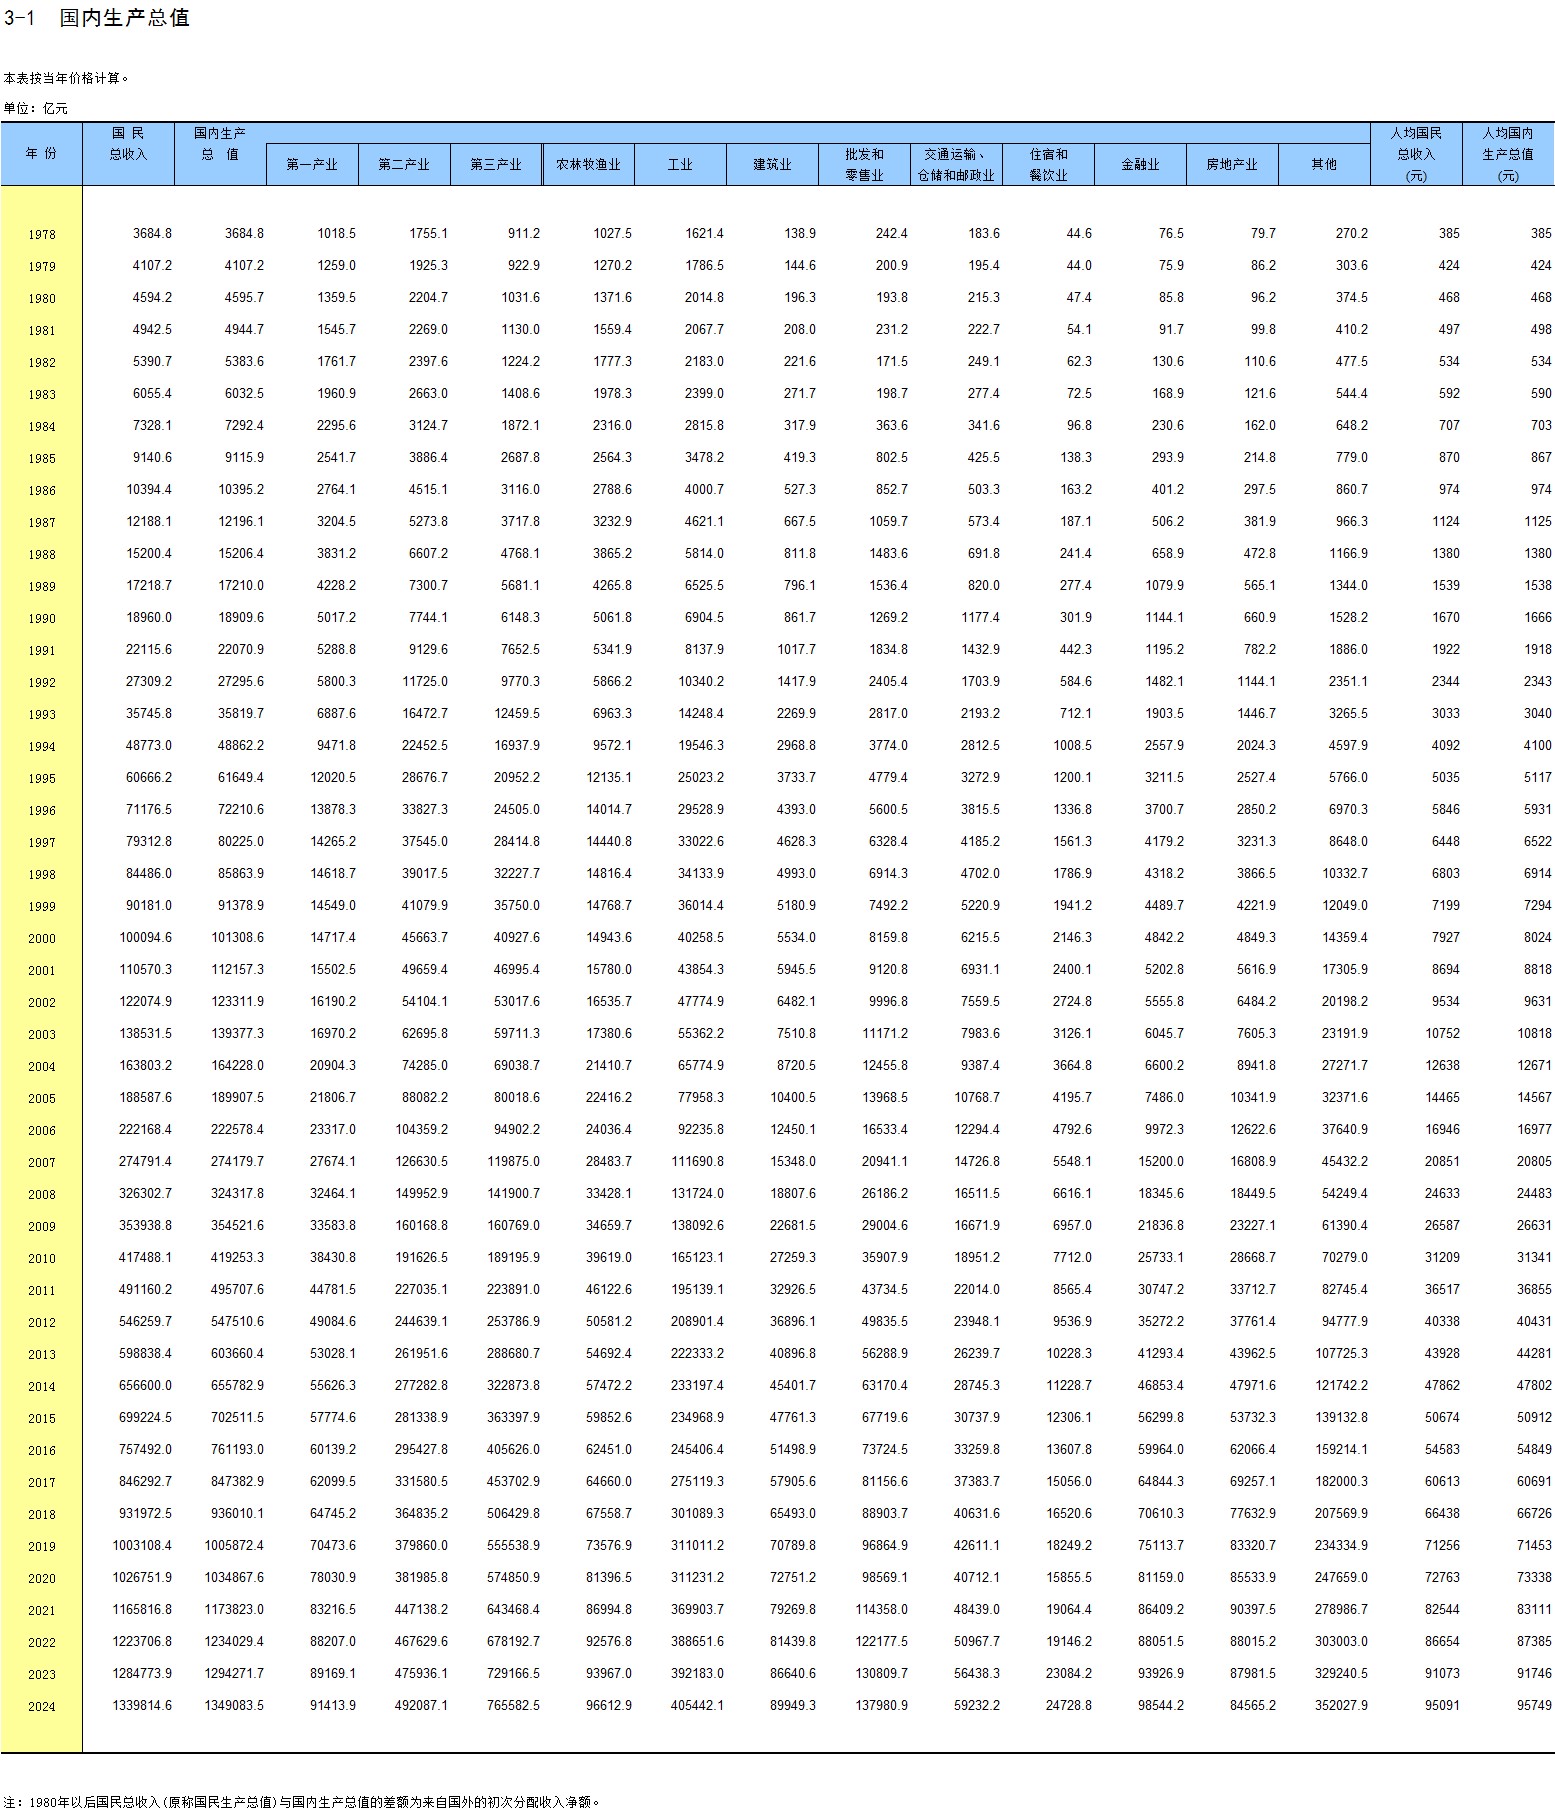
Pair a provincial sum from one vintage with a national figure from another and the gap belongs to the comparison rather than to the economy.
Method
- Unit. Source documents are in 亿元 (100 million yuan) at current prices. I converted to trillion yuan and rounded to two decimals. The gaps printed in the table are those subtracted columns; the percentages are my arithmetic on the unrounded sums, which is why a printed gap sometimes rounds to a different hundredth than its own percentage would give.
- Coverage. Each regional table has 31 data rows, one per provincial-level unit; the 2024 verification’s annex says the national series excludes Hong Kong, Macao and Taiwan (2024 verification announcement, annex 2, 2025-12-26).
- Vintage. Each provincial sum is the one printed in the yearbook edition published the following year. It is compared with the preliminary figure published in January or February after the year, and with the later verification or census revision. The current revised series appears only in the three-row table above, where that difference is the point.
- Two independent reads. The regional tables are images, so each year’s first numeric column was read twice: once by a tesseract OCR pass (Chinese plus English, word boxes, the first numeric column isolated by its x-band) and once by a separate vision pass over the same image. That is 310 cells over ten years. The two passes agree on 268 of the 279 cells they both returned. Ten of the 11 differences are the OCR pass scanning one number wrong: a dropped decimal point (上海 2015 as 2512345 for 25123.45; 江苏 2019 as 9963152 for 99631.52), a dropped leading digit (新疆 2022 as 1741.3 for 17741.3), or a truncated decimal. The 2020 edition’s first column escaped the band rule, so that year rests on the vision read alone. The eleventh difference went the other way: the vision pass gave 16695.0 for 天津 2021, where the OCR pass and a re-read of a cropped band both gave 15695.0, the value used here. Recomputing the sums from each pass gives the same total in every year where both produced a first-column read.
- What I left alone. From the 2018 edition onward the table carries a footnote: the 2018 edition’s table (2017 data) says its figures were revised using the third national agricultural census, and the editions for 2018 to 2024 data say “表中数据为初步核算数” (preliminary accounting numbers). The 2016 and 2017 editions carry none. I adjusted nothing; the sums are as printed.
- Retrieval. All reads on 2026-10-11, China Standard Time. The national portal data.stats.gov.cn refused my requests with HTTP 403, so the yearbook tables are my route to the same series.
When these figures change
The dates matter on an annually refreshed page; the date above is when every figure here was read.
| Figure | When it appears |
|---|---|
| National preliminary | January or February of the following year |
| National final verification | December of the following year in the recent record; the rule allows until January of the year after next |
| Provincial tables | With the yearbook edition published in the following year, which is when a year’s provincial sum can first be computed |
| Census revision | In place, and it rewrites the national back series (2019 for 2018, 2024 for 2023) |
What I could not check
- The 2026 yearbook. The index lists 2025 as the newest edition, so there is no 2025 provincial sum.
- The size of each mechanism. The bureau documents that some activity stays national only, and that residuals are allocated, and publishes no amount for either, so I cannot split the 0.35%–0.77% post-2019 gap.
- Cross-province activity. The only related item in the sources I read is headquarters-economy activity being accounted nationally. Whether provinces also count the same value added twice is not addressed in any document I reached.
- The post-census provincial figures for 2023. If provinces republished their 2023 figures after the fifth census revision, their sum would sit closer to 129.43 trillion. Each edition carries one year of regional data, and I did not collect later provincial figures.
- Whether the 2024 provincial sum is final. The table’s footnote calls its figures preliminary and no verified regional series is published, so it can still move.
- The 2015 restatement. The verification’s baseline works out to 68.55 trillion (689,052 minus 3,546); no document I read states that restatement directly.
- Which accounting round came first. One NBS explainer says the bureau ran the 2019 full-year unified accounting in January 2020 as the first formal implementation, and the same page says January 2020 was the first quarterly round and November 2020 the first annual one. Both sentences are on one live page, and I cannot reconcile them.
- Provincial figures as first published. I did not collect 31 provincial communiqués for ten years, so I do not know how far the yearbook values differ from what each province first printed.
- Footnotes on the 2015 and 2016 regional tables. I found none, and cannot say whether that is because there were none.
- A printed total to check my sums against. The regional tables carry no national row, so my only check on the sums is the agreement of the two reads.