Data and the world Open dataRails and infrastructure
China's rail traffic: 44 times the US, on 69% of the track
World Bank rail data to 2021: China carries 44 times America's passenger traffic on 69% of its route-km, and the two columns are not equally comparable.
Living page — numbers read from the sources on 2026-10-12, re-checked yearly.
Two numbers from the same table carry this piece. In 2019, the last full year before the pandemic, the United States had 149,489 km of railway lines and China 102,462 km, so the Chinese network was 68.5% of the American one, 69% rounded. In that same year China’s railways carried 1,438,606 million passenger-km, 1.44 trillion, against 32,483 million in the United States, 325 billion. The traffic gap is 44.29 times.
Both come from one pull of the World Bank’s World Development Indicators: series IS.RRS.TOTL.KM, rail lines, total route-km, and IS.RRS.PASG.KM, railways, passengers carried. I took the country series on 2026-10-12 through the WDI API — the route-km query and the passenger-km query are the two that matter here — and the last-updated date in the response header is 2026-10-08. The same pull covers freight, as IS.RRS.GOOD.MT.K6, and covers India.
A comparison of this shape usually comes apart in the footnotes, so the footnotes come first. The route-km column is not the same object in every country. One American line has a step in it that has nothing to do with track being lifted. Two series stop before 2021. Every number below comes from that one retrieval, and none of it is a forecast.
The figure is one PNG, rail-track-vs-traffic.png (2880 × 2724), and it can be read without the picture. Two stacked panels cover 1995 to 2021. The top panel is route length in thousand km: the United States at 148,553 km in 2021, after a step down between 2011 and 2012; China rising from 54,616 km in 1995 to 109,767 km in 2021; India dashed, at 68,103 km. The bottom panel is passenger traffic in billion passenger-km: China at 1.44 trillion in 2019 against 325 billion for the United States, then 328,251 million in 2020 and 946,499 million in 2021, with the American line stopping at 2020 because the source has no 2021 value. Both panels draw three countries and one retrieval: World Bank WDI, retrieved 2026-10-12.
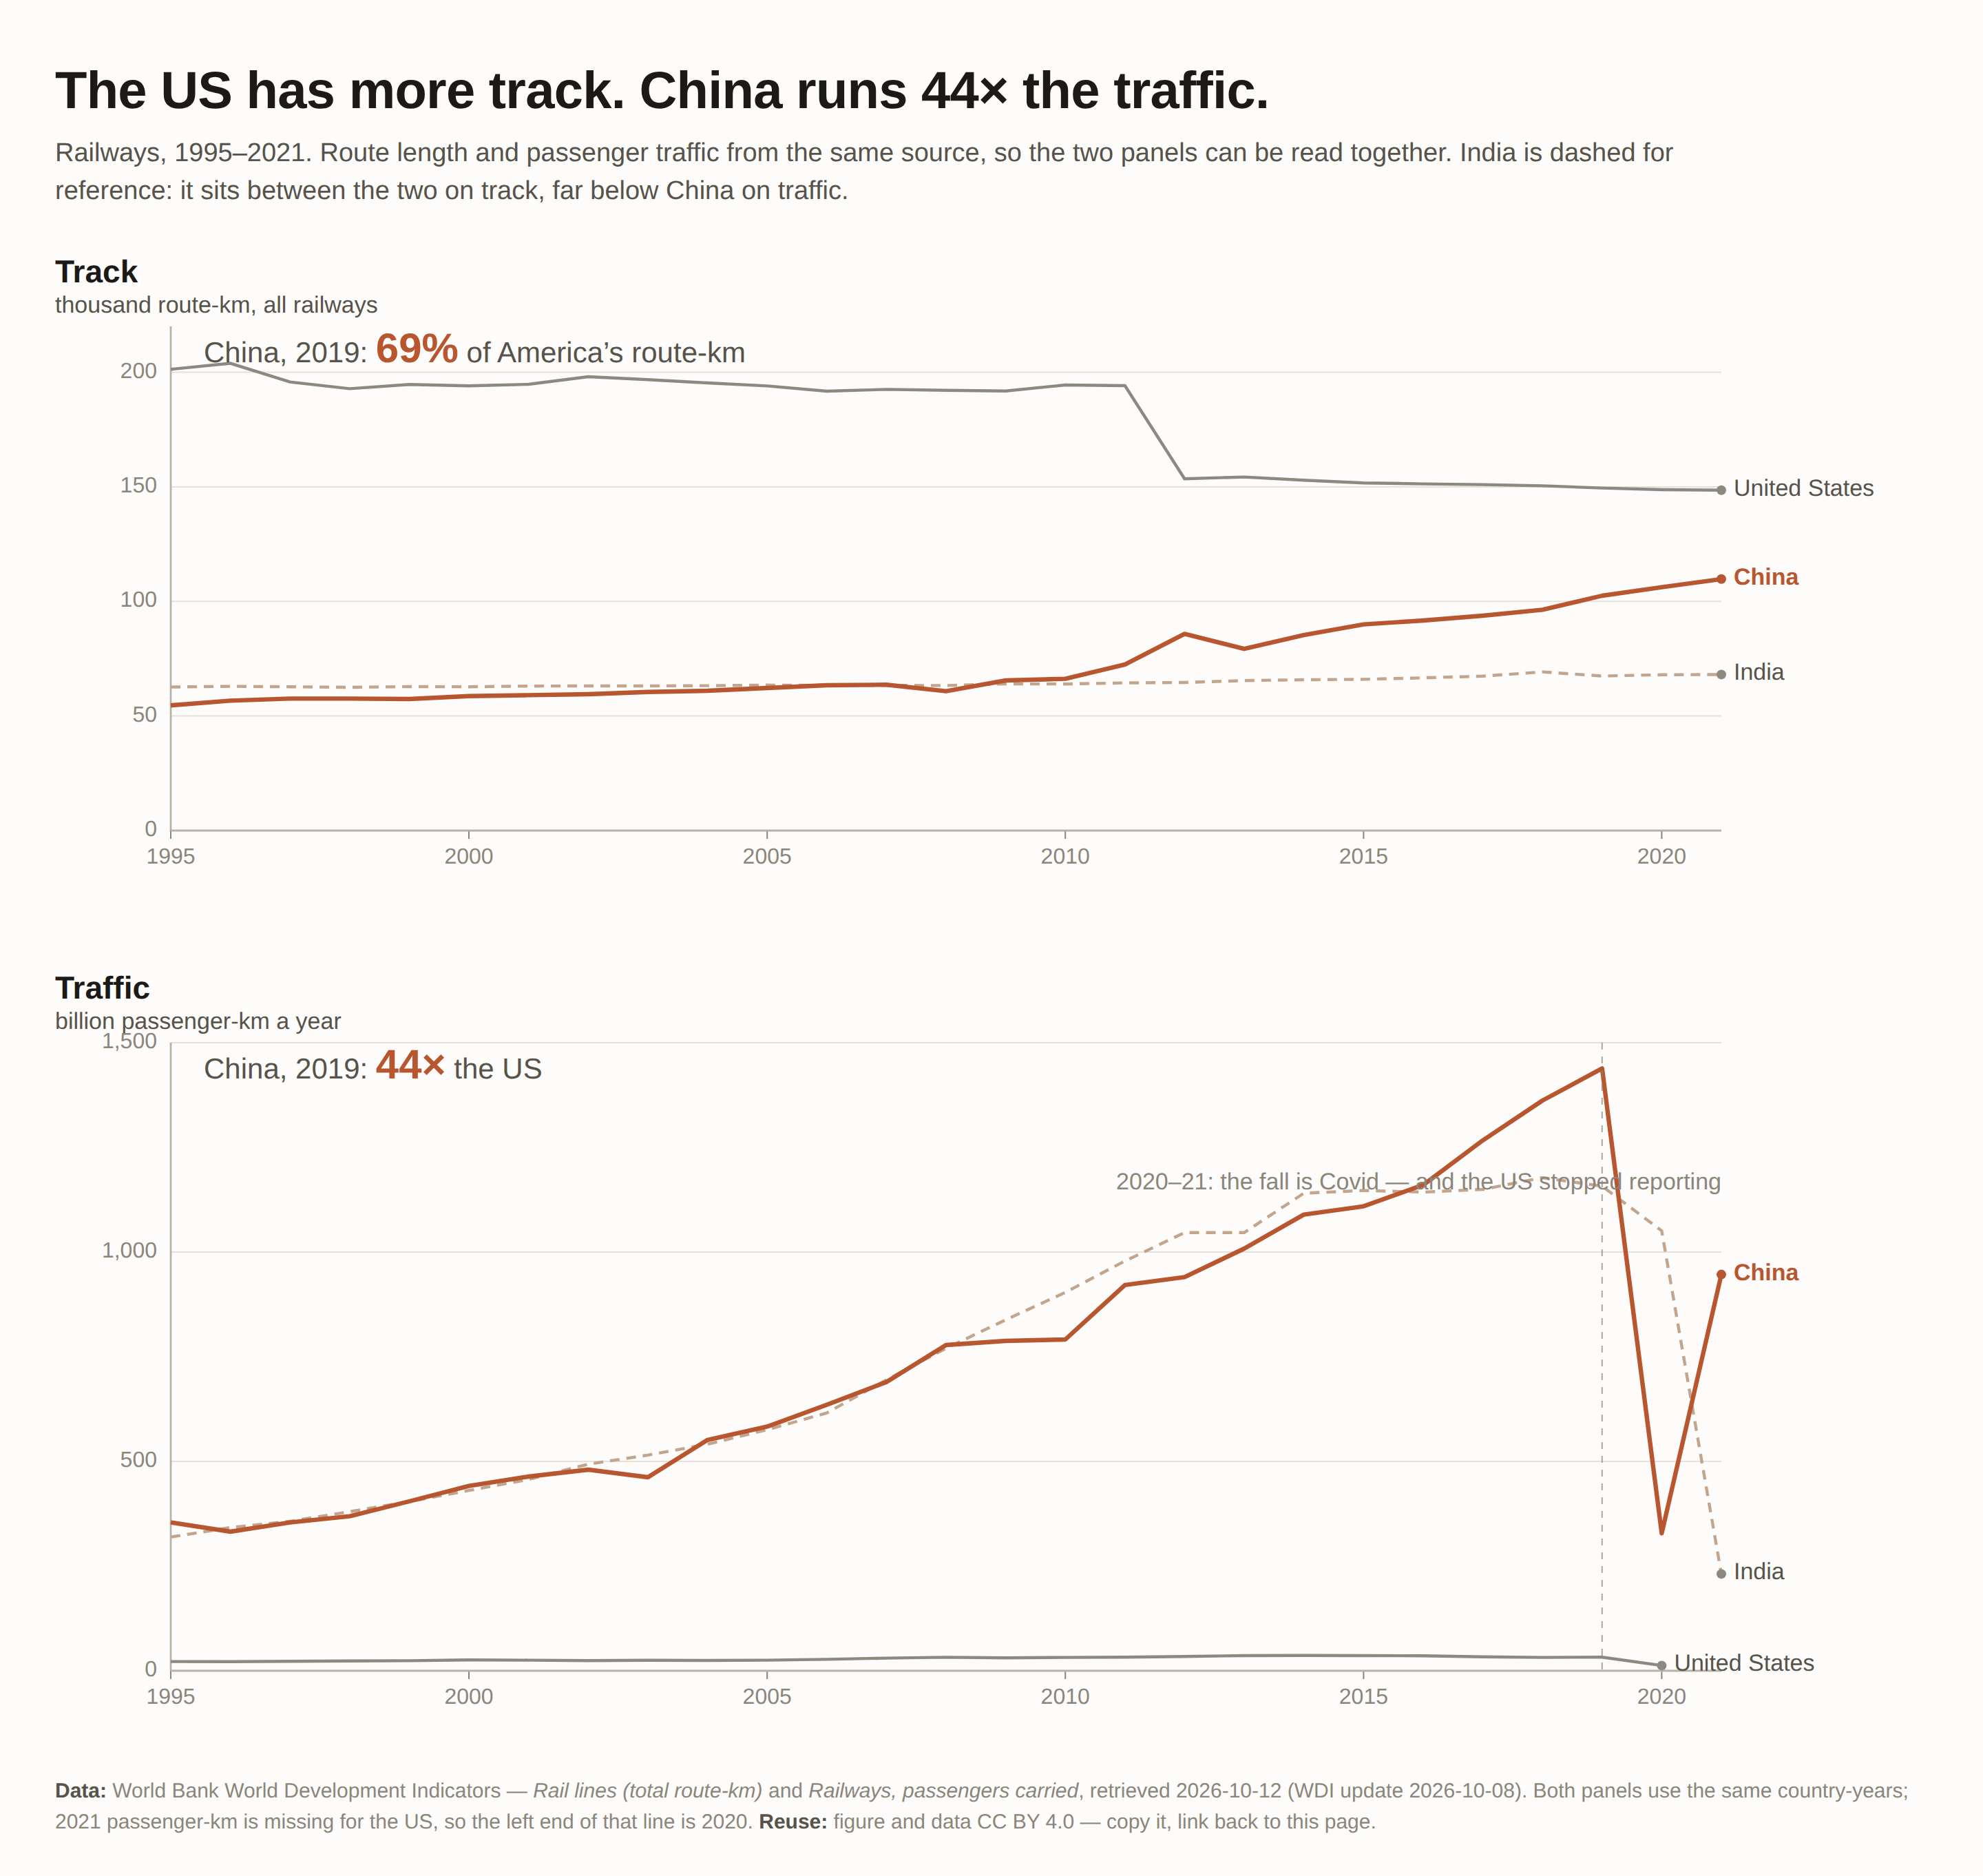
Figure and data are reusable under CC BY 4.0: credit the source, link back to this page.
The values, in one table
| Value | China | United States | India |
|---|---|---|---|
| Route-km, 2019 (km) | 102,462 | 149,489 | — |
| Route-km, 2021 (km) | 109,767 | 148,553 | 68,103 |
| Passenger-km, 2019 (million) | 1,438,606 | 32,483 | 1,157,174 |
| Passenger-km, 2020 (million) | 328,251 | — | — |
| Passenger-km, 2021 (million) | 946,499 | missing in the source | — |
| Freight ton-km, 2019 (million) | 3,018,200 | 2,357,117 | — |
A dash marks a cell this article does not quote; it is not a hole in the data. The one hole is the American passenger figure for 2021, which the file does not carry, and that is where the lower panel of the figure ends. The figure’s own headline rounds two of the ratios: 68.5% is printed as 69% of America’s route-km, and 44.29 as 44 times its traffic.
Route-km is not one measurement
China’s railway regulator published its own figure for 2021 after the year closed: 150,000 km of route in operation, of which high-speed lines accounted for 40,000 km (National Railway Administration, 2021 statistical bulletin, 28 April 2022). WDI’s value for the same country and the same year is 109,767 km. One railway system, two published totals, far apart.
Part of the reason is in WDI’s own indicator metadata, which names the source organization for rail route length as the Railisa database of the International Union of Railways (indicator metadata). The series is one cross-country collection, not the sum of national bulletins. Its definition runs to a single sentence: “The total length of rail line in the country operated for passenger transport, goods transport, or both.” How freight-only lines, sidings and station tracks are counted is not in that sentence.
So the left panel of the figure, and the route-km rows above, are approximations across borders. The passenger-km column travels better: a passenger moved one kilometre means roughly the same thing in each country’s accounting, while a kilometre of line does not.
The step in the American line
Between 2011 and 2012, WDI’s route-km for the United States drops from 194,136 km to 153,517 km. No railway was lifted on that scale in twelve months. This is a break in the series: a change in the underlying source or definition, which is why the earlier part of the American line sits so far above the later part. Read across the break, the line describes a collapse of the network that the data does not claim, and the figure leaves it in place as it stands.
The API carries no explanatory note for those two years — the observation-status field is empty for both — so the break is visible in the numbers and not explained in the file.
Passenger traffic, 44.29 times
Passenger-km is the unit this comparison can rest on. In 2019 China’s railways carried 1,438,606 million passenger-km and American railways 32,483 million. The multiple is 44.29.
The same file gives the two following years for China only: 328,251 million in 2020, then 946,499 million in 2021. The first is the pandemic year; the second is a partial recovery that is still below the 2019 level. Both are what the file holds, and they are the last values in the Chinese series here.
Passenger-km weights every trip by its length, which is why it compares countries better than a ridership count and why it also hides things. A network carrying few people a long way, and one carrying many people a short way, can land on the same number. This file holds no ridership count for either country, so nothing here separates more passengers from longer journeys.
India appears in the figure for a different reason. Its passenger traffic in 2019 was 1,157,174 million passenger-km, and its route length in 2021 was 68,103 km. Set the three countries side by side and the columns do not put them in the same order: the longest network is not the busiest.
Twenty-five years of the Chinese series
China’s route length in 1995 was 54,616 km. By 2019 it was 102,462 km, an increase of 88%. Passenger traffic over the same span rose from 354,261 million passenger-km to 1,438,606 million, about 4.1 times. The two lines on the figure’s two panels therefore do not climb at the same rate: track grew by 88% and traffic by roughly four times, and the years in between are in the CSV if a reader wants to look at them one at a time.
Freight looks nothing like this
The third rail series, IS.RRS.GOOD.MT.K6, measures goods moved in million ton-km. In 2019 China’s railways moved 3,018,200 million ton-km and American railways 2,357,117 million, roughly 1.28 times. On freight the two systems are close, which is the opposite of the passenger column.
In this retrieval the Chinese freight series ends in 2019, with the 2020 and 2021 cells empty, while the American series runs through 2021. Nothing in the file explains either decision, and I did not find a note elsewhere.
Where these numbers come from
- One retrieval. Three WDI indicators for four countries — China, the United States, India and Japan — pulled on 2026-10-12 through the World Bank API; three of those countries are quoted above. The header of the response says the series was last updated on 2026-10-08. The file is in this site’s repository as
data/rail-traffic-and-track.csv, and its header records the indicator codes and the retrieval date. - Units. Route length in kilometres; passenger-km and ton-km in millions. The figure divides the file by 1,000 so that its panels read thousand route-km and billion passenger-km.
- Arithmetic. The derived figures in this piece are the ratios stated as ratios: 68.5% and its rounded 69%, 44.29, 88%, about 4.1, about 1.28. Everything else is a value read from the file.
- The figure is generated from the CSV by
scripts/make_figure_rail.py. Both are published under CC BY 4.0.
Reuse
The figure and the CSV are available under CC BY 4.0 — copy them, credit the source and link back to this page. The data file is data/rail-traffic-and-track.csv in the repository, and the figure is regenerated from it by scripts/make_figure_rail.py.
What I could not check
- Which classes of line the WDI total counts, per country. The UIC-sourced definition is one sentence long, and I found no published bridge from it to China’s 2021 bulletin figure. Whether the two counts can be reconciled at all is something I did not establish.
- What changed in the American series between 2011 and 2012. The two observations carry no status note in the API, and I did not find the document that names the change of source behind the step.
- When the American passenger figure for 2021 will appear in the series. WDI has no value for it as of this retrieval, and I did not check whether any national publication carries a comparable figure.
- Whether China’s freight ton-km series resumes after 2019. The cells are empty from 2020 onward, and I found no note explaining the gap.
- Whether a second provider agrees. I compared no second collection — UIC’s own published tables and each national regulator’s series were both out of scope for this piece, and the Chinese bulletin above is the only outside document I opened.
- Whether 2020 and 2021 can be compared with the years before them. The dip is a pandemic year and a year of partial recovery, and the file does not separate the traffic change from the reporting change underneath it.